Download
1 / 42
420 likes | 427 Views
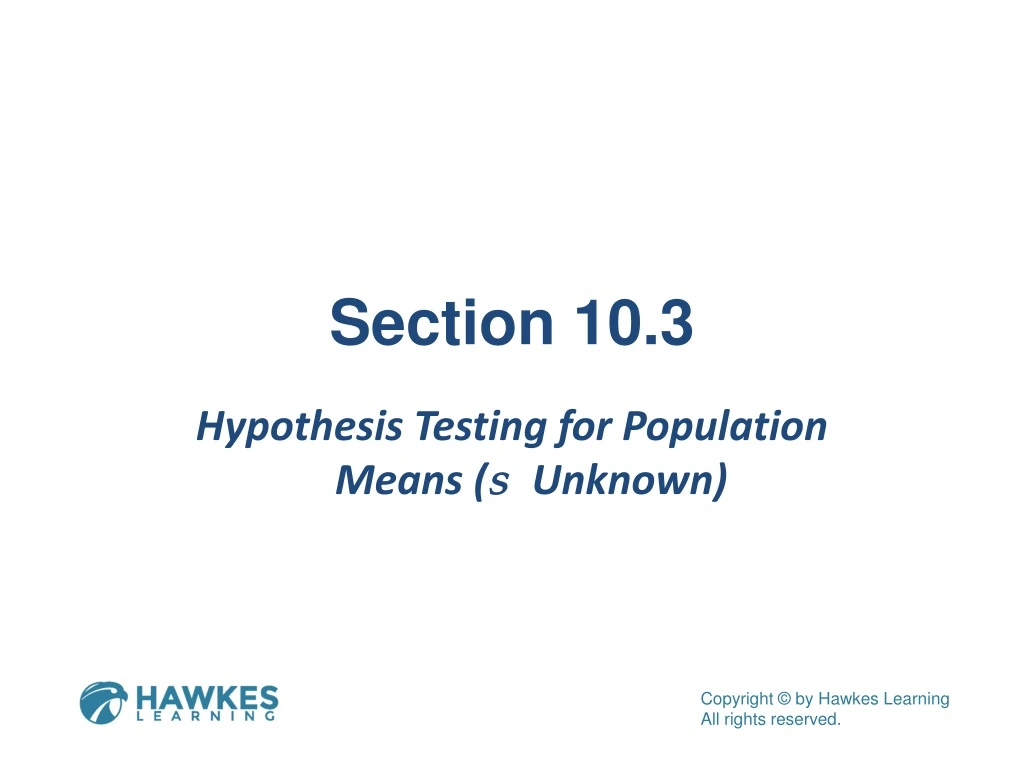
Section 10.3. Hypothesis Testing for Population Means ( s Unknown). Objectives. Interpret the conclusion to a hypothesis test. Hypothesis Testing for Population Means ( s Unknown).

E N D
Section 10.3 Hypothesis Testing for Population Means (s Unknown)
Objectives Interpret the conclusion to a hypothesis test.
Hypothesis Testing for Population Means (s Unknown) In this section, we will focus on hypothesis tests for population means where the following conditions are met. All possible samples of a given size have an equal probability of being chosen; that is, a simple random sample is used. The population standard deviation, σ, is unknown. Either the sample size is at least 30 (n ≥ 30) or the population distribution is approximately normal. When the above conditions are met, a Student’s t-distribution should be used when testing the mean.
Hypothesis Testing for Population Means (s Unknown) Test Statistic for a Hypothesis Test for a Population Mean (s Unknown) When the population standard deviation is unknown, the sample taken is a simple random sample, and either the sample size is at least 30 or the population distribution is approximately normal, the test statistic for a hypothesis test for a population mean is given by
Hypothesis Testing for Population Means (s Unknown) Test Statistic for a Hypothesis Test for a Population Mean (s Unknown) (cont.) where x̄ is the sample mean, m is the presumed value of the population mean from the null hypothesis, s is the sample standard deviation, and n is the sample size.
Hypothesis Testing for Population Means (s Unknown) Degrees of Freedom for t in a Hypothesis Test for a Population Mean (s Unknown) In a hypothesis test for a population mean where the population standard deviation is unknown, the number of degrees of freedom for the Student’s t-distribution of the test statistic is given by df = n − 1 where n is the sample size.
Hypothesis Testing for Population Means (s Unknown) Recall from the previous section that rejection regions are determined by two things: the type of hypothesis test, and the level of significance, α. Remember that to determine the type of test, simply look at the symbol contained in the alternative hypothesis. Lastly, recall that the decision rule for rejection regions is that we reject the null hypothesis if the test statistic calculated from the sample data falls within the rejection region.
Hypothesis Testing for Population Means (s Unknown) Let’s now look at how to construct rejection regions for each of the three types of hypothesis tests using a Student’s t-distribution. The basic rules are the same as those for a normal distribution, except that instead of finding the critical z-score(s), you must find the critical t-score(s).
Rejection Regions Rejection Regions for Hypothesis Tests for Population Means (s Unknown)
Hypothesis Testing for Population Means (s Unknown) The table that we will use when evaluating claims using a t-distribution is found in Table C of Appendix A. An excerpt from that table is shown.
Hypothesis Testing for Population Means (s Unknown) This table contains critical values of the t-distribution for certain numbers of degrees of freedom and commonly used levels of significance, α. To find the desired critical t-score, tαor tα/2, first find the value of α at the top of the table to determine which column of the table to use.
Hypothesis Testing for Population Means (s Unknown) Look for the value of α under the label “Area in One Tail” for a one-tailed test, or find the value of α under the label “Area in Two Tails” for a two-tailed test. Then simply scan through the table and find the cell where the degrees of freedom row and the α column intersect. Note that for a two-tailed test, the value obtained from the chart is actually tα/2 .
Example 10.19: Finding the Critical t-Value for a Right-Tailed Hypothesis Test Find the critical t-score that corresponds with 14 degrees of freedom at the 0.025 level of significance for a right-tailed hypothesis test. Solution Scanning through the table, we see that the row for 14 degrees of freedom and column for a one-tailed area of a = 0.025 intersect at a critical t-score of 2.145. Hence,
Example 10.19: Finding the Critical t-Value for a Right-Tailed Hypothesis Test (cont.)
Example 10.20: Using a Rejection Region in a Hypothesis Test for a Population Mean (Left‑Tailed, s Unknown) Nurses in a large teaching hospital have complained for many years that they are overworked and understaffed. The consensus among the nursing staff is that the mean number of patients per nurse each shift is at least 8.0. The hospital administrators claim that the mean is lower than 8.0. In order to prove their point to the nursing staff, the administrators gather information from a simple random sample of 19 nurses’ shifts. The sample mean is 7.5 patients per nurse with a standard deviation of 1.1 patients per nurse.
Example 10.20: Using a Rejection Region in a Hypothesis Test for a Population Mean (Left‑Tailed, s Unknown) (cont.) Test the administrators’ claim using a = 0.025, and assume that the number of patients per nurse has a normal distribution. Solution Step 1:State the null and alternative hypotheses. In order to determine the hypotheses, we must first ask “What do the researchers want to gather evidence for?”
Example 10.20: Using a Rejection Region in a Hypothesis Test for a Population Mean (Left‑Tailed, s Unknown) (cont.) In this scenario, the researchers are the hospital administrators, and they want to gather evidence in order to determine whether the mean number of patients per nurse is less than 8.0. We write this research hypothesis mathematically as Ha: m < 8.0. The logical opposite of m < 8.0 is m ≥ 8.0. We then have the following hypotheses.
Example 10.20: Using a Rejection Region in a Hypothesis Test for a Population Mean (Left‑Tailed, s Unknown) (cont.) Step 2: Determine which distribution to use for the test statistic, and state the level of significance. The t-test statistic is appropriate to use in this case because the claim is about a population mean, the population is normally distributed, the population standard deviation is unknown, and the sample is a simple random sample. In addition to determining which distribution to use for the test statistic, we need to state the level of significance. The problem states that a = 0.025.
Example 10.20: Using a Rejection Region in a Hypothesis Test for a Population Mean (Left‑Tailed, s Unknown) (cont.) Step 3: Gather data and calculate the necessary sample statistics. Substitute the information given in the scenario into the formula to obtain the t-test statistic.
Example 10.20: Using a Rejection Region in a Hypothesis Test for a Population Mean (Left‑Tailed, s Unknown) (cont.) Step 4: Draw a conclusion and interpret the decision. Next, notice from the symbol found in the alternative hypothesis that we are running a left-tailed test. We then need to obtain the critical t-score for the rejection region. From the table we see that a one-tailed t-test with a= 0.025 and n- 1 = 18 degrees of freedom has a critical t-score of 2.101. Because the area in a left-tailed test is shaded in the left tail of the distribution, the critical t-score will be negative,
Example 10.20: Using a Rejection Region in a Hypothesis Test for a Population Mean (Left‑Tailed, s Unknown) (cont.) The rejection region is shown in the following graph. Because the test statistic calculated from the sample, t ≈ -1.981, does not fall in the rejection region, we must fail to reject the null hypothesis.
Example 10.20: Using a Rejection Region in a Hypothesis Test for a Population Mean (Left‑Tailed, s Unknown) (cont.)
Example 10.20: Using a Rejection Region in a Hypothesis Test for a Population Mean (Left‑Tailed, s Unknown) (cont.) We can interpret this conclusion to mean that the evidence collected is not strong enough at the 0.025 level of significance to reject the null hypothesis in favor of the administrators’ claim that the mean number of patients per nurse is less than 8.0.
p-Values The t-distribution table in the back of the book cannot be used to calculate p-values in the same way that the normal distribution tables can; however, the t-table can be used to determine the range in which the p-value lies, such as 0.025 ≤ p-value ≤ 0.05. When it is important to find an exact p-value for a t-distribution, we need to turn to technology, such as calculators or statistical software programs.
p-Values Conclusions Using p-Values • If p-value ≤ a, then reject the null hypothesis. • If p-value > a, then fail to reject the null hypothesis.
Example 10.21: Performing a Hypothesis Test for a Population Mean Using a TI-83/84 Plus Calculator (Right-Tailed, s Unknown) A locally owned, independent department store has chosen its marketing strategies for many years under the assumption that the mean amount spent by each shopper in the store is no more than $100.00. A newly hired store manager claims that the current mean is higher and wants to change the marketing scheme accordingly. A group of 27 shoppers is chosen at random and found to have spent a mean of $104.93 with a standard deviation of $9.07. Assume that the population distribution of amounts spent is approximately normal, and test the store manager’s claim at the 0.05 level of significance.
Example 10.21: Performing a Hypothesis Test for a Population Mean Using a TI-83/84 Plus Calculator (Right-Tailed, s Unknown) (cont.) Solution Remember that using technology does not change the way in which a hypothesis test is performed. We will follow the steps as outlined in Section 10.1 to complete the hypothesis test. Step 1: State the null and alternative hypotheses. The store manager claims that the mean amount spent is more than $100.00, which we write mathematically as m > 100.00.
Example 10.21: Performing a Hypothesis Test for a Population Mean Using a TI-83/84 Plus Calculator (Right-Tailed, s Unknown) (cont.) Since the manager is looking for evidence to support this statement, the research hypothesis is Ha: m> 100.00. The logical opposite of the claim is then m ≤ 100.00. Thus, we have the following hypotheses.
Example 10.21: Performing a Hypothesis Test for a Population Mean Using a TI-83/84 Plus Calculator (Right-Tailed, s Unknown) (cont.) Step 2: Determine which distribution to use for the test statistic, and state the level of significance. A Student’s t-distribution, and thus the t-test statistic for population means, is appropriate to use in this case because the claim is about a population mean, the population is normally distributed, the population standard deviation is unknown, and the sample is a simple random sample. The level of significance is stated in the problem to be a = 0.05.
Example 10.21: Performing a Hypothesis Test for a Population Mean Using a TI-83/84 Plus Calculator (Right-Tailed, s Unknown) (cont.) Step 3: Gather data and calculate the necessary sample statistics. This is where we begin to use a TI-83/84 Plus calculator. Let’s start by writing down the information from the problem, as we will need to enter these values into the calculator. We know that the presumed value of the population mean is m = 100.00, the sample mean is the sample standard deviation is s = 9.07, and the sample size is n = 27.
Example 10.21: Performing a Hypothesis Test for a Population Mean Using a TI-83/84 Plus Calculator (Right-Tailed,s Unknown) (cont.) Press , scroll to TESTS, and choose option 2:T‐Test. Since we know the sample statistics, choose Stats instead of Data. For À, enter the value from the null hypothesis; thus enter 100 for À.
Example 10.21: Performing a Hypothesis Test for a Population Mean Using a TI-83/84 Plus Calculator (Right-Tailed, s Unknown) (cont.) Enter the rest of the given values, as shown in the screenshot on the left below. Choose the alternative hypothesis >À. Select Calculate. Press .
Example 10.21: Performing a Hypothesis Test for a Population Mean Using a TI-83/84 Plus Calculator (Right-Tailed, s Unknown) (cont.) The output screen, shown above on the right, shows the alternative hypothesis, calculates the t-test statistic and the p-value, and then reiterates the sample mean, sample standard deviation, and sample size that were entered.
Example 10.21: Performing a Hypothesis Test for a Population Mean Using a TI-83/84 Plus Calculator (Right-Tailed, s Unknown) (cont.) Step 4: Draw a conclusion and interpret the decision. The p-value given by the calculator is approximately 0.0045. Since 0.0045 < 0.05, we have p-value ≤ a. Thus, the conclusion is to reject the null hypothesis. This means that, at the 0.05 level of significance, the evidence supports the manager’s claim that the mean amount spent by each shopper in the department store is more than $100.00.
Example 10.22: Performing a Hypothesis Test for a Population Mean Using a TI-83/84 Plus Calculator (Two-Tailed, s Unknown) The meat-packing department of a large grocery store packs ground beef in two-pound portions. Supervisors are concerned that their machine is no longer packaging the beef to the required specifications. To test the claim that the mean weight of ground beef portions is not 2.00 pounds, the supervisors calculate the mean weight for a simple random sample of 20 packages of beef. The sample mean is 2.10 pounds with a standard deviation of 0.33 pounds. Is there sufficient evidence at the 0.01 level of significance to show that the machine is not working properly? Assume that the weights are normally distributed.
Example 10.22: Performing a Hypothesis Test for a Population Mean Using a TI-83/84 Plus Calculator (Two-Tailed, s Unknown) (cont.) Solution Step 1: State the null and alternative hypotheses. The supervisors wish to investigate whether the machinery is not working to specifications; that is, the mean weight is not 2.00 pounds per package. This research hypothesis, Ha, is written mathematically as m ≠ 2.00. The logical opposite is then m = 2.00. We then have the following hypotheses.
Example 10.22: Performing a Hypothesis Test for a Population Mean Using a TI-83/84 Plus Calculator (Two-Tailed, s Unknown) (cont.) Step 2: Determine which distribution to use for the test statistic, and state the level of significance. The t-test statistic is appropriate to use in this case because the claim is about a population mean, the population is normally distributed, the population standard deviation is unknown, and the sample is a simple random sample. The level of significance is stated to be 0.01.
Example 10.22: Performing a Hypothesis Test for a Population Mean Using a TI-83/84 Plus Calculator (Two-Tailed, s Unknown) (cont.) Step 3: Gather data and calculate the necessary sample statistics. As stated previously in Example 10.21, this is where we begin to use a TI-83/84 Plus calculator. Let’s start by writing down the information from the problem, as we will need to enter these values into the calculator. We know that the presumed value of the population mean is m = 2.00, the sample mean is the sample standard deviation is s = 0.33, and the sample size is n = 20.
Example 10.22: Performing a Hypothesis Test for a Population Mean Using a TI-83/84 Plus Calculator (Two-Tailed, s Unknown) (cont.) Press , scroll to TESTS, and choose option 2:T‐Test. Since we know the sample statistics, choose Stats instead of Data. For À, enter the value from the null hypothesis; thus enter 2 for À.
Example 10.22: Performing a Hypothesis Test for a Population Mean Using a TI-83/84 Plus Calculator (Two-Tailed, s Unknown) (cont.) Enter the rest of the given values, as shown in the screenshot on the left below. Choose the alternative hypothesis øÀ. Select Calculate. Press .
Example 10.22: Performing a Hypothesis Test for a Population Mean Using a TI-83/84 Plus Calculator (Two-Tailed, s Unknown) (cont.) The output screen, shown above on the right, shows the alternative hypothesis, calculates the t-test statistic and the p-value, and then reiterates the sample mean, sample standard deviation, and sample size that were entered.
Example 10.22: Performing a Hypothesis Test for a Population Mean Using a TI-83/84 Plus Calculator (Two-Tailed, s Unknown) (cont.) Step 4: Draw a conclusion and interpret the decision. The p-value given by the calculator is approximately 0.1912. Since 0.1912 > 0.01, we have p-value > a. Thus, the conclusion is to fail to reject the null hypothesis. We interpret this conclusion to mean that the evidence collected is not strong enough at the 0.01 level of significance to say that the machine is working improperly.