Download

1 / 35
360 likes | 688 Views
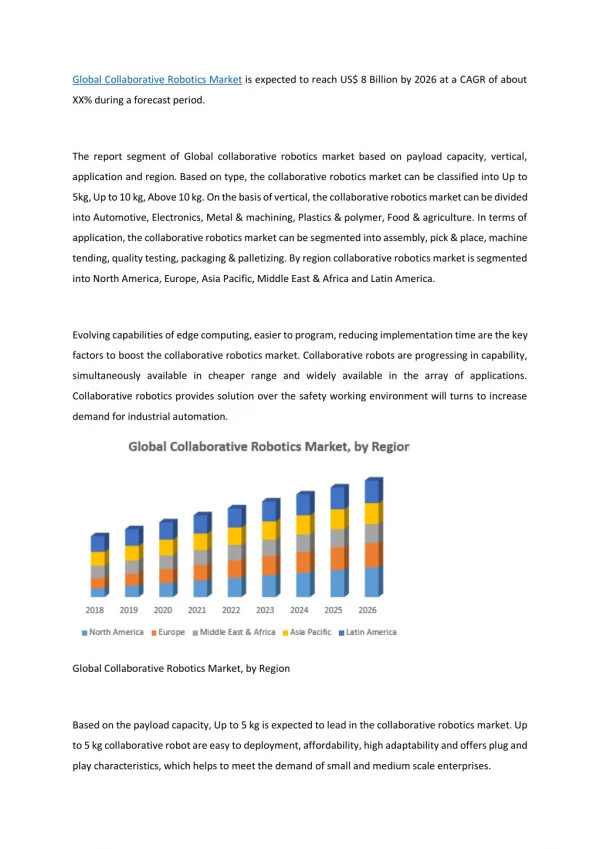
Global Robotics Market is expected to be close to USD 45 Billion by 2020. In recent years demand of robots has increased tremendously as growing trends are heading for automation and constant pioneering technical advancements in industrial robotics and service robotics. Industrial Robotics has the lion’s share of more than 80 percent in Global Robotics Market and rest is with Service Robotics. <br><br>In 2015, Global Robotics Volume was near 300,000 Units. Automotive Robotics is forecasted to control more than 50 percent of volume share in Industrial Robotics. Defence Robotics and Medical Robotics have emerged as top two segments in Service Robotics. Intuitive Surgical is the biggest company in Global Robotics Market. <br><br>Global Robotics Market, Volume & Forecast report published by Renub Research gives a complete analysis of high growth Industrial Robotics Market and Service Robotics Market globally. Report consists of 142 pages with 101 Figures and 9 Table studies the global robotics market; volume & forecast, global industrial robotics market; volume & forecast by industry segment, global service robotics market; volume & forecast by categorised segment, driving factors and challenges for Robotics market.<br><br>Visit: http://www.renub.com/global-robotics-market-volume-and-forecast-962-p.php

E N D
Global Robotics Market Volume & Forecast • Global Robotics Market, Volume & Forecast report published byRenub Research gives a complete analysis of high growth Industrial Robotics Market and Service Robotics Market globally. Report consists of 142 pages with 101 Figures and 9 Table studies the global robotics market; volume & forecast, global industrial robotics market; volume & forecast by industry segment, global service robotics market; volume & forecast by categorised segment, driving factors and challenges for Robotics market. • Global Robotics Market is divided into two parts • A. Global Industrial Robotics Market • B. Global Service Robotics Market
Continue (www.renub.com) • Global Industrial Robotics Market has been analyzed from two view points • Global Industrial Robotic Market (2010 – 2020) • Global Industrial Robotic Volume (2010 – 2020) • Industry Robotics Segments Covered • Automotive Industry • Electrical & Electronics Industry • Metal Industry • Chemical, Rubber and Plastics Industry • Food Industry • Others • Unspecified
Continue (www.renub.com) • B. Global Service Robotics Market has been analyzed from two view points • Global Service Robotic Market (2010 – 2020) • Global Service Robotic Volume (2010 – 2020) • Service Robotics Segments Covered • Defense • Agriculture (Field) • Logistic • Medical • Construction • Mobile Platform • Inspection • Underwater • Rescue and Security • All others
Continue (www.renub.com) • Key Company Analysed • Yaskawa Electric Corporation (SWOT Analysis, Sales Analysis) • KUKA AG (SWOT Analysis, Sales Analysis) • Adept Technology (SWOT Analysis, Sales Analysis) • Nachi– Fujikoshi (SWOT Analysis, Sales Analysis) • iRobot (SWOT Analysis, Sales Analysis) • Intuitive Surgical (SWOT Analysis, Sales Analysis)
Continue (www.renub.com) Data Sources This report is built using data and information sourced from proprietary databases, primary and secondary research and in–house analysis by Renub Research team of industry experts.Primary sources include industry surveys and telephone interviews with industry experts. Secondary sources information and data has been collected from various printable and non–printable sources like search engines, News websites, Government Websites, Trade Journals, White papers, Government Agencies, Magazines, Newspapers, Trade associations, Books, Industry Portals, Industry Associations and access to more than 500 paid databases.
Continue (www.renub.com) Executive Summary2. Global Robotics Market Analysis 2.1 Industrial Robotics Market & Forecast2.2 Service Robotics Market & Forecast3. Global Robotics Volume Analysis 3.1 Industrial Robotics Volume & Forecast3.2 Service Robotics Volume & Forecast
Continue (www.renub.com) 4. Global Robotics Share Analysis 4.1 Global Robotics Market Share & Forecast4.2 Global Robotics Volume Share & Forecast4.3 Industrial Robotics Market Share & Forecast4.4 Industrial Robotics Volume Share & Forecast4.5 Service Robotics Market Share & Forecast4.6 Service Robotics Volume Share & Forecast4.7 Robotics Company Market Share & Forecast
Continue (www.renub.com) 5. Industrial Robotics Market – Segments Analysis Globally (2010 – 2020) 5.1 Automotive Industry (2010 – 2020)5.2 Electrical & Electronics Industry (2010 – 2020)5.3 Metal Industry (2010 – 2020)5.4 Chemical, Rubber and Plastics Industry (2010 – 2020)5.5 Food Industry (2010 – 2020)5.6 Others (2010 – 2020)5.7 Unspecified (2010 – 2020)
Continue (www.renub.com) 6. Industrial Robotics Volume – Segments Analysis Globally (2010–2020) 6.1 Automotive Industry & Forecast6.2 Electrical & Electronics Industry & Forecast6.3 Metal Industry & Forecast6.4 Chemical, Rubber and Plastics Industry & Forecast6.5 Food Industry & Forecast6.6 Others & Forecast6.7 Unspecified & Forecast
Continue (www.renub.com) 7. Service Robotics Market – Segment Analysis Globally (2010 – 2020) 7.1 Defence Robotics Market (2010 – 2020)7.2 Agriculture & Field Robotics Market (2010 – 2020)7.3 Logistic Robotics Market (2010 – 2020)7.4 Medical Robotics Market (2010 – 2020)7.5 Construction Robotics Market (2010 – 2020)7.6 Mobile Platform Robotics Market (2010 – 2020)7.7 Inspection Robotics Market (2010 – 2020)7.8 Underwater Robotics Market (2010 – 2020)7.9 Rescue and Security Robotics Market (2010 – 2020)7.10 All Others Robotics Market (2010 – 2020)
Continue (www.renub.com) 8. Service Robotics Volume – Segment Analysis Globally (2010 – 2020) 8.1 Defence & Forecast8.2 Agriculture & Field & Forecast8.3 Logistic & Forecast8.4 Medical & Forecast8.5 Construction & Forecast8.6 Mobile Platform & Forecast8.7 Inspection & Forecast8.8 Underwater & Forecast8.9 Rescue and Security & Forecast8.10 All Others & Forecast
Continue (www.renub.com) 9. Factors Driving Robotics Growth Worldwide 9.1 Growing Research & Development Expenditure9.2 Global Adoption of Collaborative Robots are Increasing9.3 Government Drive the Robot Revolution9.4 Improved Service, Increased Operational Efficiency and Safety 10. Major Challenges for Global Robotics Marke 10.1 International Lobbies Negative Perceptions on Adoption of Robotics10.2 Global Robotics Industry is dominated by Large Players10.3 The High Cost of Robots
Continue (www.renub.com) 11. Global key Player Analysis (2010 – 2020) 11.1 Yaskawa Electric Corporation11.1.1 SWOT Analysis11.1.2 Sales Analysis11.2 KUKA AG11.2.1 SWOT Analysis11.2.2 Sales Analysis11.3 Adept Technology11.3.1 SWOT Analysis11.3.2 Sales Analysis
Continue (www.renub.com) 11.4 Nachi–Fujikoshi 11.4.1 SWOT Analysis11.4.2 Sales Analysis11.5 iRobot 11.5.1 SWOT Analysis11.5.2 Sales Analysis11.6 Intuitive Surgical 11.6.1 SWOT Analysis11.6.2 Sales Analysis
Continue (www.renub.com) List of Figures: Figure 2–1: Global – Robotics Market (Million US$), 2010–2015Figure 2–2: Global – Forecast for Robotics Market (Million US$), 2016–2020Figure 2–3: Global Industrial Robotics Market (Million US$), 2010–2015Figure 2–4: Global – Forecast for Industrial Robotics Market (Million US$), 2016–2020Figure 2–5: Global – Service Robotics Market (Million US$), 2010–2015Figure 2–6: Global – Forecast for Service Robotics Market (Million US$), 2016–2020
Continue (www.renub.com) Figure 3–1: Global – Robotics Volume (Number), 2010–2015Figure 3–2: Global – Forecast for Robotics Volume (Number), 2016–2020Figure 3–3: Global – Industrial Robotics Volume (Number), 2010–2015Figure 3–4: Global – Forecast for Industrial Robotics Volume (Number), 2016–2020Figure 3–5: Global – Service Robotics Volume (Number), 2010–2015Figure 3–6: Global – Forecast for Service Robotics Volume (Number), 2016–2020
Continue (www.renub.com) Figure 4–1: Global – Robotics Market Share (Percent), 2010–2015Figure 4–2: Global – Forecast for Robotics Market Share (Percent), 2016–2020Figure 4–3: Global – Robotics Volume Share (Percent), 2010–2015Figure 4–4: Global – Forecast for Robotics Volume Share (Percent), 2016–2020Figure 4–5: Global – Industrial Robotics Market Share (Percent) by Segment, 2010–2015Figure 4–6: Global – Forecast for Industrial Robotics Market Share (Percent) by Segment, 2016–2020Figure 4–7: Global –Industrial Robotics Volume Share (Percent) by Segment, 2010–2015Figure 4–8: Global – Forecast for Industrial Robotics Volume Share (Percent) by Segment, 2016–2020
Continue (www.renub.com) Figure 5–1: Global – Industrial Robotics Market by Automotive Industry (Million US$), 2010–2015Figure 5–2: Global – Forecast for Industrial Robotics Market by Automotive Industry (Million US$), 2016–2020Figure 5–3: Global – Industrial Robotics Market by Electrical & Electronics Industry (Million US$), 2010–2015Figure 5–4: Global – Forecast for Industrial Robotics Market by Electrical & Electronics Industry (Million US$), 2016–2020Figure 5–5: Global – Industrial Robotics Market by Metal Industry (Million US$), 2010–2015Figure 5–6: Global – Forecast for Industrial Robotics Market by Metal Industry (Million US$), 2016–2020Figure 5–7: Global – Industrial Robotics Market by Chemical, Rubber and Plastics Industry (Million US$), 2010–20152016–2020
Continue (www.renub.com) Figure 5–8: Global – Forecast for Industrial Robotics Market by Chemical, Rubber and Plastics Industry (Million US$), 2016–2020Figure 5–9: Global – Industrial Robotics Market by Food Industry (Million US$), 2010–2015Figure 5–10: Global – Forecast for Industrial Robotics Market by Food Industry (Million US$), 2016–2020Figure 5–11: Global – Industrial Robotics Market by Others (Million US$), 2010–2015Figure 5–12: Global – Forecast for Industrial Robotics Market by Others (Million US$), 2016–2020Figure 5–13: Global – Industrial Robotics Market by Unspecified (Million US$), 2010–2015Figure 5–14: Global – Forecast for Industrial Robotics Market by Unspecified (Million US$), 2016–2020
Continue (www.renub.com) Figure 6–1: Global – Industrial Robotics Volume by Automotive Industry (Number), 2010–2015Figure 6–2: Global – Forecast for Industrial Robotics Volume by Automotive Industry (Number), 2016–2020Figure 6–3: Global – Industrial Robotics Volume by Electrical & Electronics Industry (Number), 2010–2015Figure 6–4: Global – Forecast for Industrial Robotics Volume by Electrical & Electronics Industry (Number), 2016–2020Figure 6–5: Global – Industrial Robotics Volume by Metal Industry (Number), 2010–2015Figure 6–6: Global – Forecast for Industrial Robotics Volume by Metal Industry (Number), 2016–2020Figure 6–7: Global – Industrial Robotics Volume by Chemical, Rubber and Plastics Industry (Number), 2010–2015
Continue (www.renub.com) Figure 6–9: Global – Industrial Robotics Volume by Food Industry (Number), 2010–2015Figure 6–10: Global – Forecast for Industrial Robotics Volume by Food Industry (Number), 2016–2020Figure 6–11: Global – Industrial Robotics Volume by Others (Number), 2010–2015Figure 6–12: Global – Forecast for Industrial Robotics Volume by Others (Number), 2016–2020Figure 6–13: Global – Industrial Robotics Volume by Unspecified (Number), 2010–2015Figure 6–14: Global – Forecast for Industrial Robotics Volume by Unspecified (Number), 2016–2020
Continue (www.renub.com) Figure 7–1: Global – Service Robotics Market by Defence (Million US$), 2010–2015Figure 7–2: Global – Forecast for Service Robotics Market by Defence (Million US$), 2016–2020Figure 7–3: Global – Service Robotics Market by Agriculture & Field (Million US$), 2010–2015Figure 7–4: Global – Forecast for Service Robotics Market by Agriculture & Field (Million US$), 2016–2020Figure 7–5: Global – Service Robotics Market by Logistic (Million US$), 2010–2015Figure 7–6: Global – Forecast for Service Robotics Market by Logistic (Million US$), 2016–2020Figure 7–7: Global – Service Robotics Market by Medical (Million US$), 2010–2015
Continue (www.renub.com) Figure 7–11: Global – Service Robotics Market by Mobile Platform (Million US$), 2010–2015Figure 7–12: Global – Forecast for Service Robotics Market by Mobile Platform (Million US$), 2016–2020Figure 7–13: Global – Service Robotics Market by Inspection (Million US$), 2010–2015Figure 7–14: Global – Forecast for Service Robotics Market by Inspection (Million US$), 2016–2020Figure 7–15: Global – Service Robotics Market by Underwater (Million US$), 2010–2015Figure 7–16: Global – Forecast for Service Robotics Market by Underwater (Million US$), 2016–2020Figure 7–17: Global – Service Robotics Market by Rescue and Security (Million US$), 2010–2015
Continue (www.renub.com) Figure 7–18: Global – Forecast for Service Robotics Market by Rescue and Security (Million US$), 2016–2020Figure 7–19: Global – Service Robotics Market by All Others (Million US$), 2010–2015Figure 7–20: Global – Forecast for Service Robotics Market by All Others (Million US$), 2016–2020Figure 8–1: Global – Service Robotics Volume by Defence (Number), 2010–2015Figure 8–2: Global – Forecast for Service Robotics Market by All Others (Number), 2016–2020Figure 8–3: Global – Service Robotics Volume by Agriculture & Field (Number), 2010–2015Figure 8–4: Global – Forecast for Service Robotics Volume by Agriculture & Field (Number), 2016–2020
Continue (www.renub.com) Figure 8–5: Global – Service Robotics Volume by Logistic (Number), 2010–2015Figure 8–6: Global – Forecast for Service Robotics Volume by Logistic (Number), 2016–2020Figure 8–7: Global – Service Robotics Volume by Medical (Number), 2010–2015Figure 8–8: Global – Forecast for Service Robotics Volume by Medical (Number), 2016–2020Figure 8–9: Global – Service Robotics Volume by Construction (Number), 2010–2015Figure 8–10: Global – Forecast for Service Robotics Volume by Construction (Number), 2016–2020Figure 8–11: Global – Service Robotics Volume by Mobile Platform (Number), 2010–2015Figure 8–12: Global – Forecast for Service Robotics Volume by Mobile Platform (Number), 2016–2020
Continue (www.renub.com) Figure 8–13: Global – Service Robotics Volume by Inspection (Number), 2010–2015Figure 8–14: Global – Forecast for Service Robotics Volume by Inspection (Number), 2016–2020Figure 8–15: Global – Service Robotics Volume by Underwater (Number), 2010–2015Figure 8–16: Global – Forecast for Service Robotics Volume by Underwater (Number), 2016–2020Figure 8–17: Global – Service Robotics Volume by Rescue and Security (Number), 2010–2015Figure 8–18: Global – Forecast for Service Robotics Volume by Rescue and Security (Number), 2016–2020Figure 8–19: Global – Service Robotics Volume by All Others (Number), 2010–2015Figure 8–20: Global – Forecast for Service Robotics Volume by All Others (Number), 2016–2020
Continue (www.renub.com) Figure 9–1: Major Company – Research & Development Expenditure (Million US$), 2011, 2013 & 2015Figure 11–1: Yaskawa Electric Corporation – Global Robotics Sales (Million US$), 2010–2015Figure 11–2: Yaskawa Electric Corporation – Forecast for Global Robotics Sales (Million US$), 2016–2020Figure 11–3: KUKA AG – Global Robotics Sales (Million US$), 2010–2015Figure 11–4: KUKA AG – Forecast for Global Robotics Sales (Million US$), 2016–2020Figure 11–5: Adept Technology – Global Robotics Sales (Million US$), 2010–2015Figure 11–6: Adept Technology – Forecast for Global Robotics Sales (Million US$), 2016–2020Figure 11–7: Nachi–Fujikoshi – Global Robotics Sales (Million US$), 2010–2015
Continue (www.renub.com) Figure 11–8: Nachi–Fujikoshi – Forecast for Global Robotics Sales (Million US$), 2016–2020Figure 11–9:iRobot – Global Robotics Sales (Million US$), 2010–2015Figure 11–10:iRobot – Forecast for Global Robotics Sales (Million US$), 2016–2020Figure 11–11: Intuitive Surgical – Global Robotics Sales (Million US$), 2010–2015Figure 11–12: Intuitive Surgical – Forecast for Global Robotics Sales (Million US$), 2016–2020
Continue (www.renub.com) List of Tables: Table 4–1: Global – Service Robotics Market Share (Percent) by Segment, 2010–2015Table 4–2: Global – Forecast for Service Robotics Market Share (Percent) by Segment, 2016–2020Table 4–3: Global – Service Robotics Volume Share (Percent) by Segment, 2010–2015Table 4–4: Global – Forecast for Service Robotics Volume Share (Percent) by Segment, 2016–2020Table 4–5: Global – Robotics Market Share (Percent) by Company, 2010–2015Table 4–6: Global – Forecast for Robotics Market Share (Percent) by Company, 2016–2020
Continue (www.renub.com) Table 9–1: Global Collaborative–Robot Sales & Forecast Sales (unit) along with ASP and Market Size, 2015–2022Table 10–1: Global – Service Robotics Market Capitalization (Billion US$), 2016 Table 10–2: Global – Service Robotics Average Price (US$), 2016
Order Form Scan and e-mail this page to info@renub.com, alternatively one can also write the Contact Information in an e-mail and mail it. Questions? Please call +1-678-302-0700 (USA) +91-120-421-9822 (India), +91-120-424-9780 or mail to info@renub.com
Format Report Title: Global Robotics Market Volume & Forecast Order online by Credit Card (Visa, MasterCard, etc.): http://www.renub.com/global-robotics-market-volume-and-forecast-962-p.php
Order by Check Please post the check accompanied by this form, to: Company Address: Renub Research 1st Floor, C-86, Sector-10 Noida - 201301 Uttar Pradesh India Phone: +91-120-421-9822, 424-9780 For free Sample copy report or to view any of our sample work please contact us at info@renub.com or call +91-120-421-9822 (India), +1-678-302-0700 (USA)
Contact Information for Order by Check First Name: Last Name: Email: Job Title: Company: Address: City: Postal/Zip Code: Country: Phone: Mobile: Fax: Report Format: Your message: