Download

1 / 9
120 likes | 176 Views
Research Optimus (ROP) is one of the worldu2019s leading research agencies that offers white-label research services like univariate, bivariate, and multivariate data analysis to businesses and research firms. Univariate analysis is the easiest method of quantitative data analysis. Transform your business to a step ahead of your competitors adopting univariate, bivariate, or multivariate data analysis, based on your need. Hire Research Optimus - a leading outsourcing research agency u2013 and build stronger strategies to win over your customers. Contact us today.

E N D
Understanding Univariate, Bivariate and Multivariate Data Analysis
Data analysis is critical to businesses in today’s competitive times and therefore understanding the various data analysis techniques can help business owners figure out the best way forward to grow their business ahead of their competitors. There are three main analysis techniques available depending on the amount of analysis in statistics. These include - univariate, bivariate and multivariate data analysis. The number of variables, types of data, and the statistical investigation's primary objective all influence the choice of the data analysis technique. The three distinct levels of data analysis are described in the section that follows. One variable is examined during univariate data analysis. The mean, median, mode, and standard deviation are used to characterise and enumerate the features of a single variable. Understanding the distribution of a single variable and spotting outliers or anomalies both require the use of univariate data analysis.
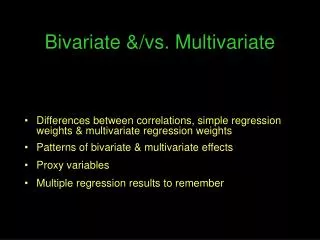
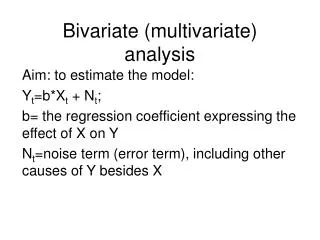
Two variables are examined in bivariate data analysis. In order to ascertain whether there is a statistically significant correlation between two variables, it is utilised to investigate the relationship between the two variables. To find trends, patterns, and correlations between the two variables, employ bivariate data analysis. Analyzing more than two variables is referred to as multivariate data analysis. It is employed to comprehend the connections between several variables and to spot any trends or patterns. The most crucial variables may be found and future outcomes can be predicted using multivariate data analysis.
Univariate, bivariate, and multivariate data analysis can be done using a variety of methodologies. These methods consist of the following: Descriptive statistics: Use descriptive statistics, to sum up, and describe the properties of a single variable or a group of variables. The mean, median, mode, and standard deviation are a few examples of descriptive statistics. Graphical techniques: The data is visualised using graphic tools, which are then utilised to spot patterns or trends. Histograms, scatterplots, and box plots are a few examples of graphical approaches. Inferential statistics: Using a sample of data, inferential statistics are used to draw conclusions or predictions about a population. T-tests, ANOVA, and regression analysis are a few instances of inferential statistics. Multivariate methods: These are employed to examine the connections between numerous variables. Factor analysis, principal component analysis, and multivariate regression are a few examples of multivariate approaches.
It is crucial to select the best technique for the particular objectives of the research and the kind of data being studied. For instance, univariate techniques like descriptive statistics or graphical techniques may be effective if the aim is to comprehend the distribution of a single variable. Bivariate techniques like regression analysis or t-tests may be appropriate if the objective is to analyse the relationship between two variables. Additionally, multivariate approaches like factor analysis or multivariate regression may be useful if the objective is to explore the correlations between many variables. In summary, a single variable is analysed in univariate data analysis, two variables are analysed in bivariate data analysis, and more than two variables are analysed in multivariate data analysis. These kinds of data analysis can be done using a variety of methods, such as multivariate methods, graphical methods, inferential methods, descriptive methods, and statistical methods. It is crucial to select the best technique for the particular objectives of the research and the kind of data being studied. One of the top research organisations in the world, Research Optimus (ROP), provides businesses and research organisations with white-label research services like univariate, bivariate, and multivariate data analysis.
THANK YOU info@researchoptimus.com www.researchoptimus.com