Download
1 / 195
1.96k likes | 1.99k Views
Network Methods for Behavior Change. INSNA Sunbelt 2018 Utrecht, Netherlands Thomas W. Valente, PhD Professor & Interim Chair Preventive Medicine, Keck School of Medicine University of Southern California tvalente@usc.edu. Outline. Network Influences on Behavior

E N D
Network Methods for Behavior Change INSNA Sunbelt 2018 Utrecht, Netherlands Thomas W. Valente, PhD Professor & Interim Chair Preventive Medicine, Keck School of Medicine University of Southern California tvalente@usc.edu
Outline • Network Influences on Behavior • Interventions & Program Implementation • Selecting a Network Intervention • Network Diagnostics • Different Networks/Measurement • Conclusions
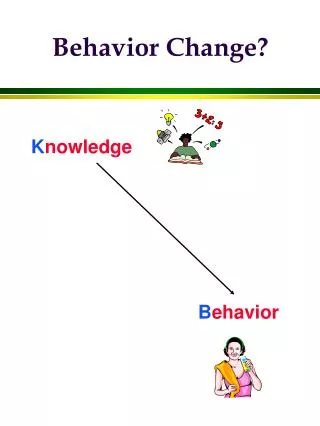
1) Networks Influences on Behavior • Knowing how and why people change behavior is important for: • understanding human behavior • getting best practices implemented • improving patient care • understanding organizational performance • etc.
Ego Network with 6 Alters B A C F Ego E D
Exposure is Associated with Adoption B A C F Ego E D Rogers & Kincaid, (1981). Communication networks: . New York: The Free Press Coleman, et al., (1966). Medical innovation: A diffusion study. New York: Bobbs-Merril.
Perceived Use is Associated Use B A C F Ego E D Valente, T. W. et al. (2013). A Comparison of Peer Influence Measures as Predictors of Smoking among Predominately Hispanic/Latino High School Students. Journal of Adolescent Health, 52, 358-364.
Simmelian Ties are Associated with Influence B A C F Ego E D Krackhardt , D. (1999). The ties that torture: Simelian tie analysis in organizations. Research in the Sociology of Organizations, 16, 183-210.
Personal Network Environment Increases Influence B A C F Ego E D Kohler, H. P. et al., the density of social networks and fertility decisions: Evidence from South Nyanza district, Kenya. Demography38 (1), 43-58
Tie Strength is Associated with Influence B A C F Ego E D Alexander et al. (2001). Peers, schools, and adolescent cigarette smoking: An analysis of the national longitudinal study of adolescent health. Journal of Adolescent Health, 29, 22-30.
Weak vs. Strong Ties • Weak ties are important for information spread and rumors • Strong ties are important for behavior change. • The more consequential the behavior, the more tie strength matters. • The more complex the behavior, the more tie strength matters.
Indirect Exposures May Matter B A G C F Ego H L I E D J K Valente, T., (1995) Network Models of the Diffusion of Innovations. Cresskill NJ: Hampton Press.
Structural Equivalence is Associated with Influence A D Ego B C Burt, R. (1987) Social contagion and innovation: Cohesion versus structural equivalence. American Journal of Sociology, 92, 1287-1335.
Centrality Weighted Exposures B A C F Ego E D Valente, T. W. (1995). Network Models of the Diffusion of Innovations. Cresskill NJ: Hampton Press.
Individuals Have Varying Thresholds Low Threshold Adopter High Threshold Adopter A B A B Ego Ego C D C D Valente, T.W. (1996). Social network thresholds in the diffusion of innovations. Social Networks, 18, 69-89.
Graph of Time of Adoption by Network Threshold for One Korean Family Planning Community 100% Threshold 0% Time 1973 1963
Diffusion of Innovations Growth Curve Inflection Points Growth or Log Phase Early or Start-up Phase Critical mass point 17
Online vs Offline Network Influences A B C F Ego E D Huang, et al. (2013). Peer influences: The impact of online and offline friendship networks on adolescent smoking and alcohol use. Journal of Adolescent Health.
Joint Participation/Identification Events Events B A 6 1 7 2 F Ego 8 3 9 4 10 D C 5 Fujimoto, K., Unger, J. &Valente, T. W. (2012). A network method of measuring affiliation-based peer influence: Assessing of teammates’ smoking on adolescent smoking. Child Development, 83, 442-451.
Alter Attributes May Affect Influence Male B A Female C F Ego C E D
Network Influence Weightings • Direct influence • Indirect ties • Structural equivalent ties • Tie strength (e.g., best friends) • Simmelian ties • Personal network density weighted • Degree (or other centrality measures) • Attribute (boy friends) • Joint participation • Thresholds
Diffusion of Innovations Growth Curve Inflection Points Growth or Log Phase Early or Start-up Phase Critical mass point 23
Networks • … of behavior change • … for behavior change • If networks are so important, how can we use them to improve outcomes, performance, function, satisfaction, etc.
2) Interventions & Program Implementation If Networks are so important, how can we use them to improve programs?
Exploration (Needs Assessment) Network Ethnography • Is there a network to work with? • What is the network position of those defining the problem? • Are there disconnected subgroups in the community? • Are there isolates who need to be connected?
Who Provides Input for Problem Definition & Program Design? Program
Community as Network • Makes explicit that problem definition and priority settings will vary depending on who provides input. • Community based organizations are always confident they can hear the voice of the community, but we are all blind to the parts of the network we can’t see. • In this example, people somewhat central in the network are involved but still other segments are left out.
Network Interventions “Network interventions are purposeful efforts to use social networks or social network data to generate social influence, accelerate behavior change, improve performance, and/or achieve desirable outcomes among individuals, communities, organizations, or populations.”
Network Interventions Defining: • Using network data to change behaviors • Change individual and community/organizational level • Not exactly clear what constitutes a network intervention, for now, any change program that uses network data to: • Select change agents • Define groups • Affect network structure • Assist in program implementation
Principle 1: Program Goals Matter • In some cases want to increase cohesion in others increase fragmentation • Or increase/decrease centralization • E.g., slowing spread of STDs may require fragmenting a sexual contact network or accelerating adoption condoms. • Network Interventions Are not Agnostic to Content.
Principle 2: Behavioral Theory • The type of change desired will be guided by theory • Understanding motivations for and barriers against behavior change is critical. • A well-articulated theory of the behavior is often critical for successful interventions.
Principle 3: Learn As Well As Induce • The interventionist should use network methodology to learn from the community as much as try to influence it. • Programs which meet the needs of their audiences are better received than those designed asymmetrically.
Strategy Tactic Tactic Tactic Operational- ization Operational- ization Operational- ization Operational- ization Operational- ization Operational- ization Operational- ization Operational- ization Operational- ization
1. Opinion Leaders • The most typical network intervention • Easy to measure • Intuitively appealing • Proven effectiveness • Over 20 studies using network data to identify OLs and hundreds of others using other OL identification techniques
Diffusion Network Simulation w/ 3 Initial Adopter Conditions
Networks for Advice Seeking on Co-occurring Disorders in 6 Clinics.
Effects on CD Treatment Note. Baseline scores, age, gender, and educational level served as covariates for each analysis of covariance. * p < .05.
HIV Sexual Risk Reduction Social Network Intervention Trials in Eastern Europe • HIV sexual risk reduction behavior interventions within indigenous friendship-based social networks in Eastern Europe - J.A. Kelly, Ph.D. and Y.A. Amirkhanian, Ph.D. (CAIR). • Social networks of Roma ethnic minority and of young MSM were identified, recruited, assessed to identify sociometric leader of each network, and then randomized into either immediate or delayed intervention condition. • The leaders of the intervention networks attended a 9-session training program and carried out HIV prevention conversations with their own network members. • Outcomes compared at Baseline, 3- and 12-months.
Roma Egocentric Network HIV Prevention Trial, Sofia, Bulgaria (N=255, 52 networks, retention>90%)Kelly, Amirkhanian, Kabakchieva et al., BMJ, 2006
Young MSM Egocentric Network HIV Prevention Trial, Bulgaria/Russia (n=276, 52 networks, retention >84%) Amirkhanian, Kelly, Kabakchieva et al., AIDS, 2005 * 12-month p indicates significance in difference between Bulgaria and Russia: The long-term effects remained strong in Bulgaria.
Cochrane Review of OL Studies (Flodgren, et al., 2011) • 18 trials • 5 trials OL vs. No Intervention, +0.09; • 2 trials OL vs. 1 Interventions, +0.14; • 4 trials OL vs. 2+ Interventions, +0.10; and • 10 trials OL+ vs. + Interventions, +0.10. • Overall, the median adjusted RD was +0.12 representing 12% absolute increase in compliance.
Achievable in UCINET • Do not symmetrize data • Compare degree scores with other centrality measures • Compare degree scores with Key Player analysis