Download
1 / 1
10 likes | 91 Views
Baking Quality Response to Late Season N with Variable Moisture During Grain Fill. K. O’Brien, B. Brown, and R. Gibson. University of Idaho. Results continued

E N D
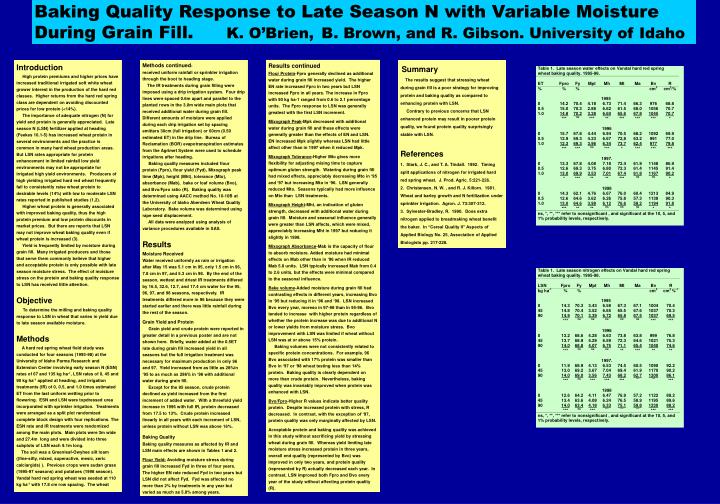
Baking Quality Response to Late Season N with Variable Moisture During Grain Fill. K. O’Brien, B. Brown, and R. Gibson. University of Idaho Results continued Flour Protein-Fpro generally declined as additional water during grain fill increased yield. The higher EN rate increased Fpro in two years but LSN increased Fpro in all years. The increase in Fpro with 90 kg ha-1 ranged from 0.6 to 2.1 percentage units. The Fpro response to LSN was generally greatest with the first LSN increment. Mixograph Peak-Mpk decreased with additional water during grain fill and these effects were generally greater than the effects of EN and LSN. EN increased Mpk slightly whereas LSN had little affect other than in 1997 when it reduced Mpk. Mixograph Tolerance-Higher Mto gives more flexibility for adjusting mixing time to capture optimum gluten strength. Watering during grain fill had mixed effects, appreciably decreasing Mto in ‘95 and ‘97 but increasing Mto in ‘96. LSN generally reduced Mto. Seasons typically had more influence on Mto than LSN treatments. Mixograph Height-Mht, an indication of gluten strength, decreased with additional water during grain fill. Moisture and seasonal influence generally were greater than LSN affects, which were mixed, appreciably increasing Mht in 1997 but reducing it slightly in 1998. Mixograph Absorbance-Mab is the capacity of flour to absorb moisture. Added moisture had minimal effects on Mab other than in ‘96 when IR reduced Mab 5.8 units. LSN typically increased Mab from 0.4 to 2.6 units, but the effects were minimal compared to the seasonal influence. Bake volume-Added moisture during grain fill had contrasting effects in different years, increasing Bvo in ‘95 but reducing it in ‘96 and ‘98. LSN increased Bvo every year, moreso in 97-98 than in 95-96. Bvo tended to increase with higher protein regardless of whether the protein increase was due to additional N or lower yields from moisture stress. Bvo improvement with LSN was limited if wheat without LSN was at or above 15% protein. Baking volumes were not consistently related to specific protein concentrations. For example, 96 Bvo associated with 17% protein was smaller than Bvo in ‘97 or ‘98 wheat testing less than 14% protein. Baking quality is clearly dependent on more than crude protein. Nevertheless, baking quality was invariably improved when protein was enhanced with LSN. Bvo/Fpro-Higher R values indicate better quality protein. Despite increased protein with stress, R decreased. In contrast, with the exception of ‘97, protein quality was only marginally affected by LSN. Acceptable protein and baking quality was achieved in this study without sacrificing yield by stressing wheat during grain fill. Whereas yield limiting late moisture stress increased protein in three years, overall end quality (represented by Bvo) was improved in only two years, and protein quality (represented by R) actually decreased each year. In contrast, LSN improved both Fpro and Bvo every year of the study without affecting protein quality (R). Introduction High protein premiums and higher prices have increased traditional irrigated soft white wheat grower interest in the production of the hard red classes. Higher returns from the hard red spring class are dependent on avoiding discounted prices for low protein (<14%). The importance of adequate nitrogen (N) for yield and protein is generally appreciated. Late season N (LSN) fertilizer applied at heading (Feekes 10.1-5) has increased wheat protein in several environments and the practice is common in many hard wheat production areas. But LSN rates appropriate for protein enhancement in limited rainfall low yield environments may not be appropriate for irrigated high yield environments. Producers of high yielding irrigated hard red wheat frequently fail to consistently raise wheat protein to desirable levels (14%) with low to moderate LSN rates reported in published studies (1,2). Higher wheat protein is generally associated with improved baking quality, thus the high protein premium and low protein discounts in market prices. But there are reports that LSN may not improve wheat baking quality even if wheat protein is increased (3). Yield is frequently limited by moisture during grain fill. Many irrigated producers and those that serve them commonly believe that higher and acceptable protein is only possible with late season moisture stress. The effect of moisture stress on the protein and baking quality response to LSN has received little attention. Objective To determine the milling and baking quality response to LSN in wheat that varies in yield due to late season available moisture. Methods A hard red spring wheat field study was conducted for four seasons (1995-98) at the University of Idaho Parma Research and Extension Center involving early season N (ESN) rates of 67 and 135 kg ha-1, LSN rates of 0, 45 and 90 kg ha-1 applied at heading, and irrigation treatments (IR) of 0, 0.5, and 1.0 times estimated ET from the last uniform wetting prior to flowering. ESN and LSN were topdressed urea incorporated with sprinkler irrigation. Treatments were arranged as a split plot randomized complete block design with four replications. The ESN rate and IR treatments were randomized among the main plots. Main plots were 3m wide and 27.4m long and were divided into three subplots of LSN each 9.1m long. The soil was a Greenleaf-Owyhee silt loam ((fine-silty, mixed, superactive, mesic, xeric calciargids) ). Previous crops were sudan grass (1995-97 seasons) and potatoes (1998 season). Vandal hard red spring wheat was seeded at 110 kg ha-1 with 17.8 cm row spacing. The wheat Methods continued- received uniform rainfall or sprinkler irrigation through the boot to heading stage. The IR treatments during grain filling were imposed using a drip irrigation system. Four drip lines were spaced 0.6m apart and parallel to the planted rows in the 3.0m wide main plots that received additional water during grain fill. Different amounts of moisture were applied during each drip irrigation set by spacing emitters 30cm (full irrigation) or 60cm (0.50 estimated ET) in the drip line. Bureau of Reclamation (BOR) evapotranspiration estimates from the Agrimet System were used to schedule irrigations after heading. Baking quality measures included flour protein (Fpro), flour yield (Fyd), Mixograph peak time (Mpk), height (Mht), tolerance (Mto), absorbance (Mab), bake or loaf volume (Bvo), and Bvo/Fpro ratio (R). Baking quality was determined using AACC method No. 10-10B at the University of Idaho Aberdeen Wheat Quality Laboratory. Bake volume was determined using rape seed displacement. All data were analyzed using analysis of variance procedures available in SAS. Results Moisture Received Water received uniformly as rain or irrigation after May 15 was 5.1 cm in 95, only 1.5 cm in 96, 7.8 cm in 97, and 5.3 cm in 98. By the end of the season, wettest and driest IR treatments differed by 16.5, 32.6, 12.7, and 17.4 cm water for the 95, 96, 97, and 98 seasons, respectively. IR treatments differed more in 96 because they were started earlier and there was little rainfall during the rest of the season. Grain Yield and Protein Grain yield and crude protein were reported in greater detail in a previous poster and are not shown here. Briefly, water added at the 0.5ET rate during grain fill increased yield in all seasons but the full irrigation treatment was necessary for maximum production in only 96 and 97. Yield increased from as little as 28%in ‘95 to as much as 286% in ‘96 with additional water during grain fill. Except for the 95 season, crude protein declined as yield increased from the first increment of added water. With a threefold yield increase in 1996 with full IR, protein decreased from 17.5 to 13%. Crude protein increased linearly in all years with each increment of LSN, unless protein without LSN was above 16%. Baking Quality Baking quality measures as affected by IR and LSN main effects are shown in Tables 1 and 2. Flour Yield- Avoiding moisture stress during grain fill increased Fyd in three of four years. The higher EN rate reduced Fyd in two years but LSN did not affect Fyd. Fyd was affected no more than 2% by treatments in any year but varied as much as 5.8% among years. Summary The results suggest that stressing wheat during grain fill is a poor strategy for improving protein and baking quality as compared to enhancing protein with LSN. Contrary to previous concerns that LSN enhanced protein may result in poorer protein quality, we found protein quality surprisingly stable with LSN. References 1. Stark, J. C., and T. A. Tindall. 1992. Timing split applications of nitrogen for irrigated hard red spring wheat. J. Prod. Agric. 5:221-226. 2. Christensen, N. W. , and R. J. Killorn. 1981. Wheat and barley growth and N fertilization under sprinkler irrigation. Agron. J. 73:307-312. 3. Sylvester-Bradley, R. 1990. Does extra nitrogen applied to breadmaking wheat benefit the baker. In “Cereal Quality II” Aspects of Applied Biology No. 25, Association of Applied Biologists pp. 217-228.