Download
1 / 12
120 likes | 291 Views
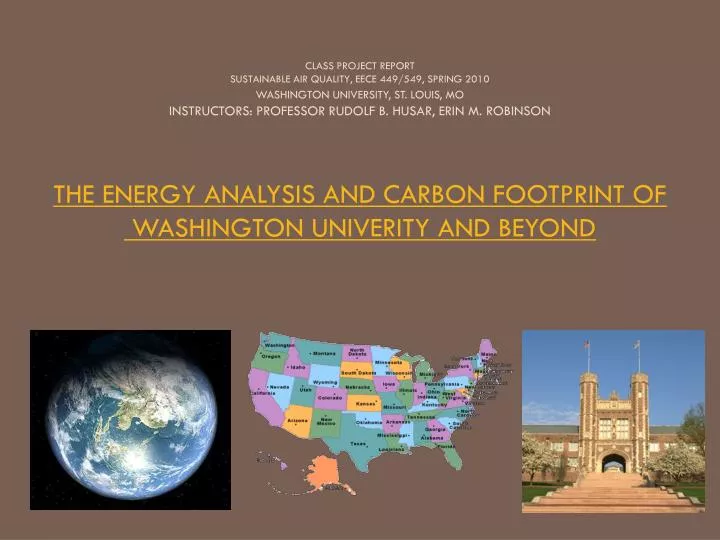
CLASS PROJECT REPORT SUSTAINABLE AIR QUALITY, EECE 449/549, SPRING 2010 WASHINGTON UNIVERSITY, ST. LOUIS, MO INSTRUCTORS: PROFESSOR RUDOLF B. HUSAR, ERIN M. ROBINSON THE ENERGY ANALYSIS AND CARBON FOOTPRINT OF WASHINGTON UNIVERITY AND BEYOND. Project List.

E N D
CLASS PROJECT REPORTSUSTAINABLE AIR QUALITY, EECE 449/549, SPRING 2010WASHINGTON UNIVERSITY, ST. LOUIS, MOINSTRUCTORS: PROFESSOR RUDOLF B. HUSAR, ERIN M. ROBINSONTHE ENERGY ANALYSIS AND CARBON FOOTPRINT OF WASHINGTON UNIVERITY AND BEYOND
Project List • Global and Regional Carbon Causality Analysis • Nick Thornburg, Will Hannon, Will Ferriby, Chris Valach • Electricity Use by Space and Application: Danforth Campus • Matt Mitchel, Jacob Cohen • DUC Energy Consumption • Sarah Canniff, Dan Zernickow, Elliot Rosenthal, T.J. Pepping, Brittany Huhmann • Electricity Use by Space and Application: DUC, Seigle • Lindsay Aronson, Alan Pinkert, Will Fischer • WUSTL Transportation Carbon Footprint Update • Michal Hyrc, Ryan Henderson, Billy Koury, Eric Tidquist • University Carbon Footprint Comparison • Shamus Keohane, Chris Holt, Kristen Schlott, Sonny Ruffino
Global/Regional Trend Objectives • National causality trend analysis of carbon emissions of specific world countries • Comparison of the causal commonalities within and among different world regions and the United States • Comprehension of global and regional patterns of carbon dioxide emissions over time for insight into the driving forces of climate change • Quantified causality model of data from 60 world countries and US for future project use
Approach and Methodology CO2 Emissions = Population x GDP/Person x Energy/GDP x CO2/Energy • Population: The total number of people living in a country at a certain point in time. • GDP/Person: Total GDP in a country divided by its population. Indicates the national economic development and prosperity. • Energy/GDP: Total kg oil consumed per unit GDP. Indicator of the energy intensity of a country’s economy. • CO2/Energy: Metric tons of CO2 emitted per kg oil consumed. Measure of the carbon intensity and content of energy consumption.
Causality Factors for Saudi Arabia • Increases in Population and Energy/GDP • Decrease in GDP/Person and CO2/Energy • The Population and Energy/GDP both drive Carbon Emissions up while GDP/Person and CO2/Energy drive it down. • Increase in Population and GDP/Person • Decrease in Energy/GDP and CO2/Energy • Now the forces driving CO2 up are GDP/Person and Population while Energy/GDP and CO2/Energy drove it down.
Causality Factors for South Africa • Transition from population as the driving force to GDP as the driving force • CO2 emissions have decreased because of lowering of population and a lowering of energy per GDP.
Regional Causality: Europe • Convergence to two points of CO2 emissions per capita • Eastern European Countries: decreasing their emissions to get to these points. • Western European countries: remaining relatively the same in their Carbon/Capita emissions.
Regional Causality: South America 975% increase! • Principal Causality Factor: GDP/Person: Economy is responsible for footprint. • GDP/Person: skyrocketing trend from 1960-2005. Shift in economic nature. • Energy/GDP: net decrease over 35 year time period. • CO2/Energy: relative stability,near-zero trend evolution changing fuel type is responsible. • Note the uncanny relativity between causal factor magnitudes in countries. • Slight convergence over time: Evolution from 14-fold to only 3-fold difference!
Regional Causality: Southeast Asia 1732% increase! 1663% Increase!
Regional Causality: United States Overall US Emissions were driven up by GDP increases, moderated by decreases in Energy/GDP
Summary and Conclusions • Regional causality frameworks and case studies of countries prove strong socioeconomic and historical dependence of causal factors • No such “master formula” for causality analysis • Intrinsic relationship with economic development • Significance of geographical placement • Parallel of trends and driving factors in the US • Economic development mostly responsible, dampened by lowered energy intensity • Establishment of framework for sustainable future
References (Global) • http://www.google.com/publicdata/overview?ds=d5bncppjof8f9_ • https://www.cia.gov/library/publications/the-world-factbook/geos/ve.html • http://inflationdata.com/inflation/inflation_Rate/Historical_Oil_Prices_Table.asp • http://web.archive.org/web/20080226202420/http://www.jica.go.jp/english/global/pov/profiles/pdf/sau_eng.pdf • http://www.state.gov/r/pa/ei/bgn/35639.htm • http://www2.census.gov/prod2/statcomp/documents/1980-02.pdf • https://www.cia.gov/library/publications/the-world-factbook/geos/br.html • https://www.cia.gov/library/publications/the-world-factbook/geos/ar.html • http://en.wikipedia.org/wiki/France#Economy • http://www.bea.gov/regional/index.htm#gsp • http://www.census.gov/compendia/statab/ • http://en.wikipedia.org/wiki/Economy_of_Thailand • http://web.worldbank.org/WBSITE/EXTERNAL/COUNTRIES/LACEXT/HONDURASEXTN/0,,contentMDK:21035522~pagePK:141137~piPK:141127~theSitePK:295071,00.html • http://www40.statcan.gc.ca/l01/cst01/econ40-eng.htm • http://www.statcan.gc.ca/pub/88-221-x/2008002/part-partie1-eng.htm • http://capitawiki.wustl.edu/ME449-07/index.php/Image:All_State_Energy_BTU_EmissionR.xls • http://www.eia.doe.gov/emeu/states/_seds.html • http://www.epa.gov/climatechange/emissions/state_energyco2inv.html • http://www.eia.doe.gov/oiaf/1605/state/state_emissions.html • http://www.eia.doe.gov/oiaf/1605/ggrpt/carbon.html • http://open.worldbank.org/countries/AFG/indicators/EN.ATM.CO2E.KT?per_page=100&api_key=4kzbhfty3mz6v293vrq5uphw&date=1960:2005 • http://datafedwiki.wustl.edu/index.php/2010-02-15:_World_Bank_Coutry_Data • http://capitawiki.wustl.edu/EECE449/index.php/Global-Regional_Trends_of_Carbon_Emissions • http://capita.wustl.edu/me449%2D00/