Download
1 / 17
170 likes | 181 Views
Regressing REDD Reference Levels. Simone Bauch & Arild Angelsen School of Economics and Business Norwegian University of Life Sciences (UMB). UMB projects on REDD+ Ref.Levels. CIFOR + partners Global Comparative Study on REDD+ Funded by NORAD+ 2009-2013+ C1: National policies and politics

E N D
Regressing REDD Reference Levels Simone Bauch & Arild Angelsen School of Economics and BusinessNorwegian University of Life Sciences (UMB)
UMB projects on REDD+ Ref.Levels • CIFOR + partners Global Comparative Study on REDD+ • Funded by NORAD+ • 2009-2013+ • C1: National policies and politics • C2: REDD+ projects’ evaluation • C3: Ref.levels and MRV • Global • Brazil, Indonesia, Vietnam • Other smaller projects • DEEC, UK – input to negotiations • Meridian III report on ref.levels • Advice to Norway’s Climate Forest Initiative, e.g. Indonesia Institutt for økonomi og ressursforvaltning
REDD Basics • Pay (incentivize and compensate) countries for Reducing Emission from Deforestation and forest Degradation (REDD) • Emission reduction = reference level – actual emissions in a given time period • Main challenge: How to set reference levels? • One of 3 key issues highlighted by the Cancun decision for further consultations this year Institutt for økonomi og ressursforvaltning
What are reference levels? Several definitions for reference levels, but refer to two very distinct meanings: • BAU: counterfactual, or what would have happened without REDD. The yardstick for measuring the effect of REDD policies or interventions • Crediting levels: The yardstick for payment. Can be seen as a modified BAU, incorporates considerations about e.g. efficient use of limited REDD resources, and higher responsibilities for middle-income than low income countries • The BAU is where research can contribute the most: • how to predict deforestation
Forest carbon stock Past emissions (’historical baseline’) REDD credits Realised pathCrediting baselineBAU baseline Time Commitment period Reference levels
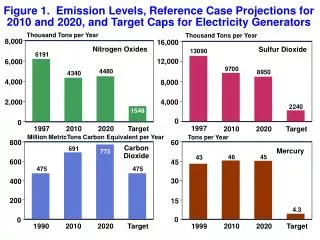
Contentious but important issue • Changes in reference period and year change payments considerably USD100 million * based on 120 tons C/ha and USD 5/tCO2
Reference year: Institutt for økonomi og ressursforvaltning USD250 million
In addition to historical deforetstaion, there are other factors that affect deforestation... Forest stock: forest transition curve Source: Angelsen, 2008
What else to consider? To know what would happen we need to know what are drivers of deforestation? • Agricultural commodities: soy, cattle, oil palm (prices) • Household consumption: fuelwood, timber, etc • Land tenure: assert ownership of land • National historical deforestation • National circumstances: • Forest cover, reflecting stage in forest transition • GDP/capita • Other factors • War, disasters, …. • Population • Commodity prices • Ex post adjustment: • Brazil being rewarded due to the economic crisis Proposal: regression models
How to include these other factors? • Different levels for different types of countries: what defines these types? • How to select variables to include in BAU? • Regression models: allows us to evaluate multiple dimensions simultaneously • Predictive model: what will deforestation be in the near future? Institutt for økonomi og ressursforvaltning
Regression results Bigger coefficients Institutt for økonomi og ressursforvaltning
Robustness checks: Random Effects model Institutt for økonomi og ressursforvaltning
Robustness check: state level data Institutt for økonomi og ressursforvaltning N= 9 states x 5 years
Robustness check: each year separately • Model 1: very robust. • Model 2: Institutt for økonomi og ressursforvaltning
Model fit • With deforestation predictions for 2010 and 2011. Institutt for økonomi og ressursforvaltning
Some major conclusions • Historical deforestation is key in predicting deforestation • But can improve by including more factors • Poverty cannot be used as argument to adjust BAU in Brazil • Causal factors that drive deforestation, are still important factors after including historical deforestation • continuous pressure, no instant equilibrium of forest stock • The distinction made in the debate between historical and predicted deforestation is artificial • Comparing RL proposals: • Historical deforestation: simplest, assumes linearity • Categories (ad hoc cutoffs): relatively simple, might compromise additionality • Regression: more complex and realistic Institutt for økonomi og ressursforvaltning
Thank you! • arild.angelsen@umb.no • sibauch@umb.no Institutt for økonomi og ressursforvaltning