Download
1 / 13
130 likes | 308 Views
Martin Schaffernicht Facultad de Ciencias Empresariales Universidad de Talca Talca – Chile martin@utalca.cl. Causality and diagrams for system dynamics. Students have a hard time learning to correctly use polarity .

E N D
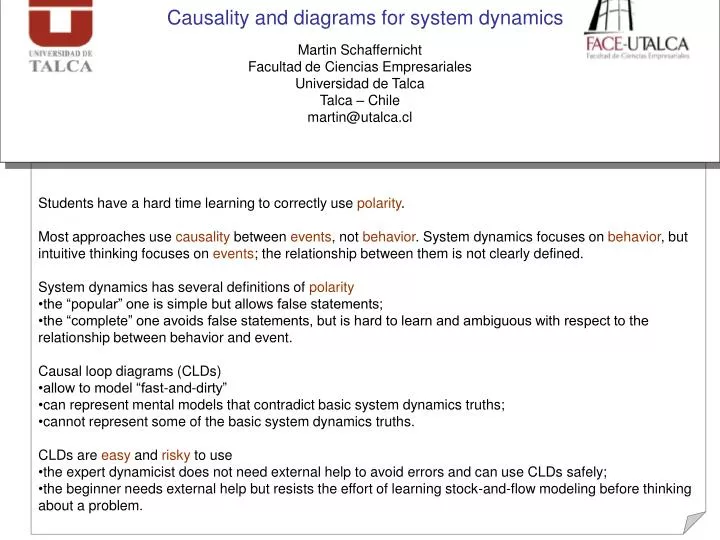
Martin Schaffernicht Facultad de Ciencias Empresariales Universidad de Talca Talca – Chile martin@utalca.cl Causality and diagrams for system dynamics • Students have a hard time learning to correctly use polarity. • Most approaches use causality between events, not behavior. System dynamics focuses on behavior, but intuitive thinking focuses on events; the relationship between them is not clearly defined. • System dynamics has several definitions of polarity • the “popular” one is simple but allows false statements; • the “complete” one avoids false statements, but is hard to learn and ambiguous with respect to the relationship between behavior and event. • Causal loop diagrams (CLDs) • allow to model “fast-and-dirty” • can represent mental models that contradict basic system dynamics truths; • cannot represent some of the basic system dynamics truths. • CLDs are easy and risky to use • the expert dynamicist does not need external help to avoid errors and can use CLDs safely; • the beginner needs external help but resists the effort of learning stock-and-flow modeling before thinking about a problem.
1 Causality in different approaches
2 What is “behavior” (that it is not an “event”)? Quantitative Computer the sequence of quantities the trend (quality of behavior) Levels of description Specialization “first descends”, then grows” “decreases” Event the change of the trend “switches from decreasing to growth” Qualitative Modeler Behavior
3 The “popular” definition (between behavior and event) dt dV dV dt dt dt dV1 dt dV1 dV2 dV2 dt dt dt dV2 dV1 dV1 dV2 dt dt when the independent variable changes, then the dependent variable changes in the same direction “positive” when the independent variable changes, then the dependent variable changes in the opposite direction “negative” Change = dV1 - dV2 Change = dV Behavior as change of quantities Behavior as change of the quality of behavior (event)
4 The “complete” definition (between behavior and event) when the independent variable changes with a particular sign (+ or -), then the following values of the dependent variable will be above (or less) than what they would have been. “positive” when the independent variable changes with a particular sign (+ or -), then the following values of the dependent variable will be less(or above) than what they would have been. “negative” Behavior aschange of quantities Behavior as change of the quality of behavior (event)
5 Famous example: population dynamics + - population + - + + births deaths + + This part of the CLD is used to critique the “causal loop diagram” language as a tool for “systems thinking” in pedagogical contexts. natality mortality + + birth control policy public health policy See the “population case.itm” model in the additional material.
6 What a CLD can say (but should not) + population “Popular” definition “Complete” definition Is the moment of bifurcation an event? ? births ? ? ? Ifbirths decrease, thenpopulation will decrease. Ifbirths decrease, thenpopulation will be less than what it would have been. “Complete” definition seems to avoid contradiction. However, “less than what would have been” does not imply “no absolute decrease”.
7 What a CLD should say (but cannot) + population Any definition births 0 0 No “flow” variables that are “inflow” or “outflow”, no quantities No bounds on quantities (like a negative inflow). No “stock” variables that maintain values A constant independent variable can lead to a growing dependent variable. No flow-stock integration
8 Famous example once more: population decreases! What does “ceteris paribus” then mean: “population has no other influences” or “all other influences on population remain as they are”? Population depends on various variables and also influences them. births population is too reduced. + - population + - births deaths + + + + natality mortality + + birth control policy public health policy Experiment with the “population case.itm” model in the additional material.
9 Concluding arguments (cog.map) CLDs allow event-oriented (intuitive) thinking. CLDs have few implied concepts. CLDs allow to go fast and do not require much previous study. Use of CLDs does not educate proper systems thinking. Thinking with CLD is popular. We generally cannot avoid to make behavioral interpretations CLDs allow false behavioral interpretations. A beginner is likely to think in terms of constructs and events. He is not aware of the “hazard zones”. + An expert can think in terms of variables and behavior; he embodies the rules and will not err: CLDs as shorthand. Use by experts OK. Only disciplined use in teaching!
10 Concluding arguments (cog. map) A beginner is likely to think in terms of constructs and events. He is not aware of the “hazard zones”. System dynamics has several “complicated” concepts. We generally cannot avoid to make behavioral interpretations - Learning “stock-and-flow” thinking and modeling takes time. Adults have few time to learn. Improve definition of relationships with “event thinking” approaches. Start teaching earlier. An expert can think in terms of variables and behavior; he embodies the rules and will not err: CLDs as shorthand.
11 System dynamics references • Booth-Sweeney, L. and Sterman, JD., 2000. Bathtub dynamics: initial results of a systems thinking inventory, System Dynamics Review16(4): 249–286 • Coyle, G. 1998. The practice of system dynamics: milestones, lessons and ideas from 30 years experience. System Dynamics Review 14(4), (Winter 1998): 343±365 • Homer, J. and Oliva, R. 2001. Maps and models in system dynamics: a response to Coyle, System Dynamics Review Vol. 17, No. 4, (Winter 2001): 347–355 • Moxnes, E. and Saysel, A. Misperceptions of Global Climate Change: Information Policies • Moxnes, E., 1998, Overexploitation of renewable resources: The role of misperceptions, Journal of Economic Behavior & Organization Vol. 37 (1998) 107-127 • Moxnes, E., 2000. Not only the tragedy of the commons: misperceptions of feedback and policies for sustainable development, System Dynamics Review16(4):325–348 • Moxnes, E., 2004. Misperceptions of basic dynamics: the case of renewable resource management, System Dynamics Review20(2): 139-162 • Pedercini, M. 2006. What’s behind the blue arrow? - The notion of causality in System Dynamics; Proceedings of the 24th International Conference of the System Dynamics Society, Nijmegen • Richardson, 1991 Feedback thought in social sciences and systems theory. Pegasus Communications • Richardson, G. P. 1997 Problems in causal loop diagrams revisited, System Dynamics Review Vol. 13, No. 3, (Fall 1997): 247–252 • Richardson, G. P. 2006 Concept Models. Proceedings of the 24th International Conference of the System Dynamics Society, Nijmegen • Richmond, B., 1993, Systems thinking: critical thinking skills for the 1990s and beyond, System Dynamics Review Vol. 9, no. 2 (Summer 1993):113-133 • Sterman, JD. 1989. Modeling managerial behavior: misperceptions of feedback in a dynamic decision making experiment. Management Science35(35): 321-339 • Sterman, John, 2000. Busyness Dynamics – systems thinking and modeling for a complex world, John Wiley • Warren, Kim, 2004. Why has feedback systems thinking struggled to influence strategy and policy? Systems Research and Behavioral Scienc; Jul/Aug 2004; 21, 4; pg. 331 • Wheat, David. 2007. The Feedback Method - A System Dynamics Approach to Teaching Macroeconomics, PhD thesis, University at Bergen, March 2007 • Wolstenholme, E. 1990. Systems Enquiry. Wiley
12 Other references (selcted) • General sources • Hume, D. 1984 Enquiry concerning the human Understanding [Investigación sobre el conocimiento humano], (Translated by Jaime de Salas Ortueta), Alianza Editorial, Madrid • Gopnik, A.; Glymour, C. ; Sobel, David M. ; Schulz, L. E. ; Kushnir, T. and Danks, D. 2004. A theory of causal learning in children: Causal maps and Bayes nets. Psychological Review, 2004, 111, 1, 1-30 • Allan. L. and Tangen, J. 2005. Judging Relationships Between Events: How Do We Do It? Canadian Journal of Experimental Psychology; Mar 2005; 59, 1; pg. 22 • Heider, F., 1958. The Psychology of Interpersonal Relations. New York: Wiley • López, F., Cobos, P. and Caño, A. 2005. Associative and causal reasoning accounts of causal induction: Symmetries and.asymmetries in causal predictions and diagnostic inferences, Memory & Cognition; Dec 2005; 33, 8; pg. 1388 • Kahnemann, D. 2002. Maps of bounded rationality: a perspective on intuitive judgment and choice, Nober Prize Lecture, December 8, 2002 • Kelley, H. H. 1973. The processes of causal attribution. American Psychologist, 28, 107-128. • Causal diagram sources • Halper, J. and Pearl, J. 2005a. Causes and Explanations: A Structural-Model Approach. Part I: Causes, Brit. J. Phil. Sci. 56 (2005), 843–887 • Halper, J. and Pearl, J. 2005b. Causes and Explanations: A Structural-Model Approach. Part II: Explanations, Brit. J. Phil. Sci. 56 (2005), 889–911 • Pearl, J. 1955. Causal diagrams for empirical research, Biometrika (1995), 82,4, pp. 669-710 • Cognitive mapping • Eden, C. 1990. Using cognitive mapping for Strategic Options Development and Analyses (SODA), in J. Rosenhead (Ed.), Rational Analysis for a Problematic World, Wiley: Chchester • Howick, S. Ackermann, F. and Andersen, D., 2006. Linking event thinking with structural thinking: methods to improve client value in projects, System Dynamics Review Vol. 22, No. 2, (Summer 2006): 113–140 • Mental model sources • Axelrod R (ed.) 1976. The Structure of Decision: The Cognitive Maps of Political Elites. Princeton University Press: Princeton, NJ. • Doyle, F. and Ford, A. 1998. Mental model concepts for system dynamics research, System Dynamics Review 14(1), (Spring 1998): 3-29 • Doyle, F. and Ford, A. 1999. Mental model concepts revisited: some clarifications and a reply to Lane, System Dynamics Review 15(4), (Winter 1999): 411-415 • Johnson-Laird, P. N. 1999. Deductive reasoning, Annual Review of Psychology; 1999; 50: 109-135