Download
1 / 14
140 likes | 235 Views
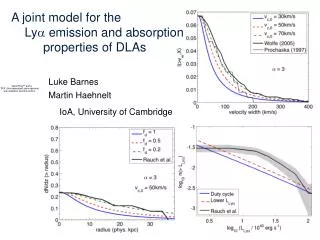
CCAT - Sept13/06, Cardiff Population of Far-IR background galaxies & z-machine style emission line surveys. Scott C. Chapman (IoA Cambridge). Galaxy Evolution: Where are we, where do we go?.

E N D
CCAT - Sept13/06, CardiffPopulation of Far-IR background galaxies& z-machine style emission line surveys Scott C. Chapman (IoA Cambridge)
Galaxy Evolution:Where are we, where do we go? 1) Currently only scratching the surface of luminous/massive galaxies (Spitzer and Herschel are/will help considerably) -still unsure if we have census of all z~2 luminous galaxies 2) To really understand galaxy formation and evolution (<M* galaxies), we need larger facilities. -finding the hyper-luminous peaks in different bands not enough.
Counts and Models 24um • Old models (Dole+, Chary/Elbaz, Chapman/Lewis, etc.) easily fit data • Spitzer forced refinements to models (eg., Lagache+04) • -strength of aromatics/PAHs, range of SEDs for a given luminosity • -epoch dependent density and luminosity evolution
N(z) Spitzer and submm galaxies 15um/24um hump at z~1 from 6-9um/11-14um aromatics also z~2 hump in 24um from 6-9um aromatics? (Chapman,Lewis,Helou 2003, 2005 model predictions) K-corrections mean that 15/24/850 probe CIB in well-defined, and distinct z ranges: z=0.7 (15um), z=1.1 (24um), z=2.3 (850um)
Components of FIRB (SCUBA2 and CCAT) 350 850 Dole et al. 2005 Submm is almost all high-z galaxies (80% z<4) MidIR and FarIR is 80% z<1.7 SMM best (only?) way to probe the high-z components of FIRB
SCUBA contribution to mm/FIRB • >0.5mJy SCUBA population produces 80-100% of 850um background • CCAT territory! • Median redshift of bright SMGs is z~2.3 • Fit dust SEDs to radio/850um at known z • 850um population produces bulk of the >400um FIRB Corrected for <5mJy sources >5mJy Arp220 SED >5mJy fitted SMG SEDs
The Star Formation History of the Universe • X-ray & extended-radio => SCUBA galaxies not dominated by AGN • interpret far-IR luminosities in terms of star formation (30% AGN) • SMGs are the main site of massive star formation at z>2 • UV galaxies evolve differently from SCUBA galaxies • Balance between obscured and unobscured SF has shifted drastically in last 80% THub UV-selected L* ? SCUBA Spitzer -- SPICA/BLISS, ALMA, LMT, CCAT25 (Chapman et al. 2004)
Confusion Currently impossible to probe high-z galaxies in FarIR! Nowhere near probing IR morphologies
Submm/FIR Continuum: CCAT deep surveys… Bivariate LF (Chapman+03) to model Td distribution. 200 350 600 850 850 160
Molecular/Fine Structure emission lines 6x15m IRAM PdB Interferometer • Molecular gas defines sites of star formation • IRAM-PdBI Needs precise redshifts (500Mhz band) • 30 SMGs observed, 18 detected in CO • (Neri et al. 2003, Greve et al. 2005, Tacconi et al. 2005) CO(3-2)
Longest baselines: Hi-Res CO studies (Tacconi et al. 2005)
Fine Structure Lines: COLD, 3.5m aperture ULIRG Cii CCAT/z-spec
Simulation of all galaxies in 1’ beam: -Bivariate LF : emission line templates matched to Arp220 or M82 based on dust temperature. -14 brightest galaxies contribute the bulk of the detectable lines. -CCAT targeted low-res spectroscopy could survey large numbers of obscured galaxies for redshifts, line strengths and ratios.