Download
1 / 1
10 likes | 128 Views
Evaluation of Precipitation Products to Force a Global Flood and Drought Prediction System N. Voisin 1 , D.P. Lettenmaier 1 and E.F. Wood 2 1 Department of Civil and Environmental Engineering 2 Department of Civil and Environmental Engineering

E N D
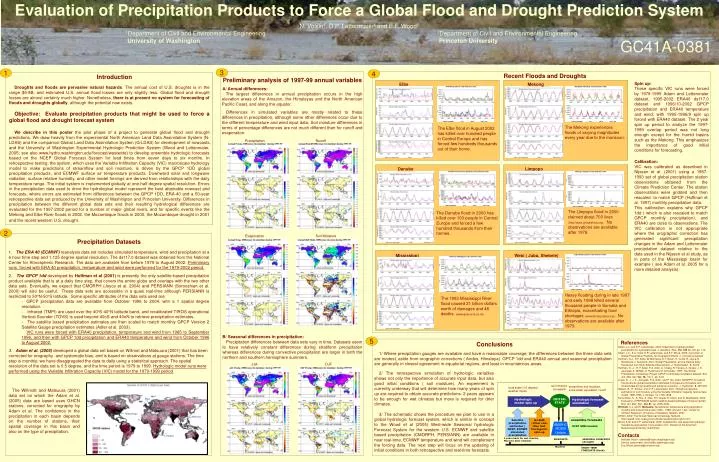
Evaluation of Precipitation Products to Force a Global Flood and Drought Prediction System N. Voisin1, D.P. Lettenmaier1 and E.F. Wood2 1Department of Civil and Environmental Engineering 2Department of Civil and Environmental Engineering University of Washington Princeton University H13E-0466 GC41A-0381 3 1 4 Recent Floods and Droughts Introduction Droughts and floods are pervasive natural hazards. The annual cost of U.S. droughts is in the range $6-8B, and estimated U.S. annual flood losses are only slightly less. Global flood and drought losses are almost certainly much higher. Nonetheless, there is at present no system for forecasting of floods and droughts globally, although the potential now exists. Objective: Evaluate precipitation products that might be used to force a global flood and drought forecast system We describe in this poster the pilot phase of a project to generate global flood and drought predictions. We draw heavily from the experimental North American Land Data Assimilation System (N-LDAS) and the companion Global Land Data Assimilation System (G-LDAS) for development of nowcasts, and the University of Washington Experimental Hydrologic Prediction System (Wood and Lettenmaier, 2005; see also www.hydro.washington.edu/forecast/westwide) to develop ensemble hydrologic forecasts based on the NCEP Global Forecast System for lead times from seven days to six months. In retrospective testing, the system, which uses the Variable Infiltration Capacity (VIC) macroscale hydrology model to make predictions of streamflow and soil moisture, is driven by the GPCP 1DD global precipitation products, and ECMWF surface air temperature products. Downward solar and longwave radiation, surface relative humidity, and other model forcings are derived from relationships with the daily temperature range. The initial system is implemented globally at one-half degree spatial resolution. Errors in the precipitation data used to drive the hydrological model represent the best attainable nowcast and forecasts, where errors are estimated from differences between the GPCP 1DD, ERA-40 and a 50-year retrospective data set produced by the University of Washington and Princeton University. Differences in precipitation between the different global data sets and their resulting hydrological differences are evaluated for the 1997-2002 period for a number of major global rivers, and for specific events like the Mekong and Elbe River floods in 2002, the Mozambique floods in 2000, the Mozambique drought in 2001 and the recent western U.S. drought. Preliminary analysis of 1997-99 annual variables Spin up: These specific VIC runs were forced by 1979-1999 Adam and Lettenmaier dataset, 1995-2002 ERA40 ds117.0 dataset and 1996/10-2002 GPCP precipitation and ERA40 temperature and wind, with 1995-1996/9 spin up forced with ERA40 dataset. The 2 year spin up period to analyze the 1997-1999 overlap period was not long enough except for the humid basins such as the Mekong. This emphasizes the importance of good initial conditions for forecasting. Mekong Elbe A/ Annual differences: The largest differences in annual precipitation occurs in the high elevation areas of the Amazon, the Himalayas and the North American Pacific Coast, and along the equator. Differences in simulated variables are mostly related to these differences in precipitation, although some other differences occur due to the different temperature and wind input data. Soil moisture differences in terms of percentage differences are not much different than for runoff and evaporation. The Mekong experiences floods of varying magnitudes every year due to the monsoon. The Elbe flood in August 2002 has killed over hundred people in Central Europe and has forced few hundreds thousands out of their home. Precipitation Runoff Calibration: VIC was calibrated as described in Nijssen et al. (2001) using a 1987-1993 set of global precipitation station observations obtained from the Climate Prediction Center. The station observations were gridded and then rescaled to match GPCP (Huffman et al. 1997) monthly precipitation data. This calibration explains why GPCP 1dd ( which is also rescaled to match GPCP monthly precipitation), and ERA40 are close to observations. The VIC calibration is not appropriate where the orographic correction has generated significant precipitation changes in the Adam and Lettenmaier precipitation dataset relative to the data used in the Nijssen et al study, as in parts of the Mississippi basin for example ( see Adam et al. 2005 for a more detailed analysis). Danube Limpopo The Limpopo flood in 2000 claimed about 700 lives (http://www.unisdrafrica.org). No observations are available after 1979. The Danube flood in 2000 has killed over 100 people in Central Europe and forced a few hundred thousands from their homes. 2 Evaporation Soil Moisture • Precipitation Datasets • 1. The ERA 40 (ECMWF)reanalysis data set includes simulated temperature, wind and precipitation at a 6 hour time step and 1.125 degree spatial resolution. The ds117.0 dataset was obtained from the National Center for Atmospheric Research. The data are available from before 1979 to August 2002. Preliminary runs forced with ERA 40 precipitation, temperature and wind were performed for the 1979-2002 period. • 2. The GPCP 1dd developed by Huffman et al (2001) is presently the only satellite-based precipitation product available that is at a daily time step, that covers the entire globe and overlaps with the two other data sets. Eventually, we expect that CMORPH (Joyce et al. 2004) and PERSIANN (Sorooshian et al. 2000)will also be useful. These data sets are accessible in a quasi real-time although PERSIANN is restricted to 50oN-50oS latitude. Some specific attributes of the data sets used are: • GPCP precipitation data are available from October 1996 to 2004, with a 1 spatial degree resolution. • Infrared (TMPI) are used over the 40oS-40oN latitude band, and recalibrated TIROS operational Vertical Sounder (TOVS) is used beyond 40oS and 40oN to retrieve precipitation estimates. • The satellite based precipitation estimates are then scaled to match monthly GPCP Version 2 Satellite Gauge precipitation estimates (Adler et al. 2003). • VIC runs were forced with ERA40 precipitation, temperature and wind from 1985 to September 1996, and then with GPCP 1dd precipitation and ERA40 temperature and wind from October 1996 to August 2002. • 3. Adam et al. (2005) developed a global data set based on Willmot and Matsuura (2001) that has been corrected for orography and systematic bias, and is based on observations at gauge stations. The time step is monthly; we have disaggregated the data to daily using a statistical approach. The spatial resolution of the data set is 0.5 degree, and the time period is 1979 to 1999. Hydrologic model runs were performed using the Variable Infiltration Capacity (VIC) model for the 1979-1999 period. Webi ( Juba, Shebele) Mississippi Heavy flooding during in late 1997 and early 1998 killed several thousand people in Somalia and Ethiopia, exacerbating food shortages (www.db.idpproject.org). No observations are available after 1979. The 1993 Mississippi River flood caused 21 billion dollars worth of damages and 48 deaths. (www.gesource.ac.uk) B/ Seasonal differences in precipitation: Precipitation differences between data sets vary in time. Datasets seem to have relatively constant differences during stratiform precipitation whereas differences during convective precipitation are larger in both the northern and southern hemisphere summers. 5 References Adam, J.C. and D.P. Lettenmaier, 2003: Adjustment of global gridded precipitation for systematic bias, J. Geophys. Res., Vol. 108 No. D9, pp 1-14. Adam, J.C., E.A. Clark, D.P. Lettenmaier, and E.F. Wood, 2005: Correction of Global Precipitation Products for Orographic Effects .J. Climate(accepted) Huffman, G.J., R.F. Adler, M. Morrissey, D.T. Bolvin, S. Curtis, R. Joyce, B McGavock, J. Susskind, 2001: Global Precipitation at One-Degree Daily Resolution from Multi-Satellite Observations. J. Hydrometeor., 2, 36-50. Huffman, G. J. , R. F. Adler, P. A. Arkin, A. Chang, R. Ferraro, A. Gruber, J. E. Janowiak, A. McNab, B. Rudolf and U. Schneider, 1997: The Global Precipitation Climatology Project (GPCP) combined precipitation dataset. Bull. Am. Met. Soc. Vol. 78,, No. 1, pp. 5-20 Joyce, R. J., J. E. Janowiak, P. A. Arkin, and P. Xie, 2004: CMORPH: A method that produces global precipitation estimates from passive microwave and infrared data at high spatial and temporal resolution. J. Hydromet., 5, 487-503. Nijssen, B., R. Schnur, and D. P. Lettenmaier, 2001: Global retrospective estimation of soil moisture using the Variable Infiltration Capacity land surface model, 1980-1993. J. Climate, 14, 1790-1808. Sorooshian, S., K. Hsu, X. Gao, H.V. Gupta, B. Imam, and D. Braithwaite, 2000: Evaluation of PERSIANN system satellite-based estimates of tropical rainfall. Bull. Am. Met. Soc., Vol. 81, pp. 2035-2046. Willmott, C.J. and K. Matsuura, Terrestrial air temperature and precipitation: monthly and annual time series (1950 - 1999) (Version 1.02). Center for Climatic Research, University of Delaware, Newark, 2001. GHCN, 2002: The Global Historical Climatology Network. http://www5.ncdc.noaa.gov/ol/climate/research/ghcn/ghcn.html Wood, A.W. and D.P. Lettenmaier, 2005, A testbed for new seasonal hydrologic forecasting approaches in the western U.S., Bulletin of the American Meteorological Society (submitted). Contacts Nathalie Voisin: nathalie@hydro.washington.edu Dennis Lettenmaier: dennisl@u.washington.edu Eric Wood: efwood@princeton.edu Conclusions 1/ Where precipitation gauges are available and have a reasonable coverage, the differences between the three data sets are modest, aside from orographic corrections ( Andes, Himalaya). GPCP 1dd and ERA40 annual and seasonal precipitation are generally in closest agreement in equatorial regions, and least in mountainous areas. JJA DJF 2/ The retrospective simulation of hydrologic variables shows not only the importance of accurate input data, but also good initial conditions ( soil moisture). An experiment is currently underway that will determine how many years of spin up are required to obtain accurate predictions. 2 years appears to be enough for wet climates but more is required for drier climates. 3/ The schematic shows the procedure we plan to use in a global hydrologic forecast system, which is similar in concept to the Wood et al (2005) West-wide Seasonal hydrologic Forecast System for the western U.S. ECMWF and satellite based precipitation (CMORPH, PERSIANN) are available in near real-time. ECMWF temperature and wind will complement the forcing data. The next step will focus on the updating of initial conditions in both retrospective and real-time forecasts. soil moisture snowpack streamflow, soil moisture, snow water equivalent, runoff local scale (1/2 degree) weather inputs The Willmott and Matsuura (2001) data set on which the Adam et al. (2005) data are based uses GHCN stations, corrected for orography by Adam et al. The confidence in the precipitation in each basin depends on the number of stations, their spatial coverage in this basin and also on the type of precipitation. Elbe INITIAL STATE Hydrologic model spin up Hydrologic forecast simulation ensemble forecasts NCEP GSM ensemble Satellite precipitation estimates / NCEP, ECMWF simulated precipitation G-LDAS /other real-time met. forcings for spin-up Mississippi Mekong AMSR-E MODIS Update Webi SNOTELUpdate Limpopo 2 years back for wet climate, More for drier climates NOWCASTS SEASONAL FORECASTS (drought) Month 0 SHORT TERM FORECASTS (flood)