Download
1 / 15
150 likes | 393 Views
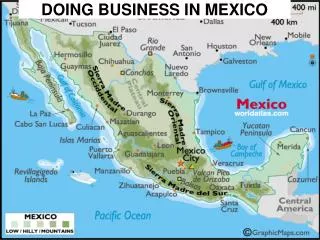
Diabetes along the U.S.-Mexico Border: an overview. This section is under continuous update. U.S.-MEXICO BORDER a site for merging cultures and behaviors. Ten States: 70 million people. 25 US counties 34 Mexican municipalities 24 Native American Nations 11.4 million people.

E N D
Diabetes along the U.S.-Mexico Border: an overview • This section is under continuous update
U.S.-MEXICO BORDER • a site for merging cultures and behaviors Ten States: 70 million people 25 US counties 34 Mexican municipalities 24 Native American Nations 11.4 million people
Project Rationale • WHO estimated that by 2025 diabetes will increase between 150-200% • It is estimated that 5-14% of the total health expenditure will be used for diabetes • Along the U.S.-Mexico border, diabetes mortality rates are higher than national figures.
Project Rationale (cont.) • In 1996 there were 161,000 diabetes hospital discharges with an average length of stay of 5.1 days in the U.S. • Diabetes is 2-3 times higher in Mexican Americans than in non-Hispanics • Uncontrolled diabetes makes difficult treatment of infectious diseases (i.e., TB)
Additional considerations • Large minority population in the U.S. border (average Hispanic population 70%) • Population growth rate (4.3% for Mexico and 1.8% for U.S) higher than national rates ( 1.9%) Mexico, (0.9%) U.S.
Additional considerations • High poverty levels on both side of the border • Five of the seven poorest counties of the U.S. are located in the border • More than 30% of the Hispanic population uninsured • Several border communities are designated “Medically Under-Served Areas”
Facts about diabetes among Hispanics • In 1998, about 1.2 million Hispanic were known to have diabetes in the U.S. • One in every four Mexican Americans age 45 and older has diabetes • Being overweight or physically inactive is a major risk for developing diabetes. • Hispanics have higher incidence of developing diabetes complications Source: www.niddk.nih.gov/health/diabetes/pubs/hipan/hipan.htm
Distribution of the Hispanic Diabetic population in U.S. (1982-1984) Source: www.niddk.nih.gov/health/diabetes/pubs/hipan/hipan.htm
Diabetes Mortality Rates for Selected U.S.-Mexico Border Communities, 1995-1997 Source: PAHO. Mortality Profiles of the Sister Communities on the United States-Mexico Border. Washington, D.C. 1995-1997
Risk and associated factors of Diabetes type II • Older age • Obesity • Malnutrition • Physical inactivity • Gestational diabetes • Race/ethnicity • Low health care access
Diabetes Mortality Rates El Paso, Texas, 1990-1998 Source: soupfin.tdh.state.tx.us/cgi-bin/deathcgi Rate per 100,000
Diabetes Mortality Rates: USA, Texas, El Paso, Juarez, Chihuahua, and Mexico, 1998 Source: PAHO. Mortality Profiles of the Sister Communities on the United States-Mexico Border. Wahsington, D.C. 1995-1997
Diabetes Mortality Rates by RaceTexas and El Paso, 1990-1994-1998 Diabetes Mortality Rates by RaceEl Paso, Texas 1990-1994-1998 Diabetes Mortality Rates by RaceTexas 1990-1994-1998 Source: soupfin.tdh.state.tx.us/cgi-bin/deathcgi Rate per 100,000
Hispanic Diabetes Mortality Rates by ageEl Paso, Texas, 1990-1994-1998 Source: soupfin.tdh.state.tx.us/cgi-bin/deathcgi Rate per 100,000
People Reduce death rate by 7.8/100,000 Gente Reduce death rate by 10% Reduce diabetes morbidity by 25% Healthy People / Gente 2010 Goals