Download
1 / 44
440 likes | 450 Views
MED-CSP Concentrating Solar Power for the Mediterranean Region WP1: Sustainability Goals WP2: Renewable Energy Technologies WP3: Renewable Energy Resources WP4: Demand Side Analysis WP5: Scenario & Market Strategies (Energy) WP6: Socio-Economical Impacts WP7: Environmental Impacts.

E N D
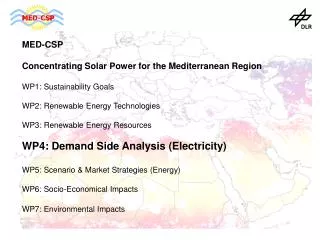
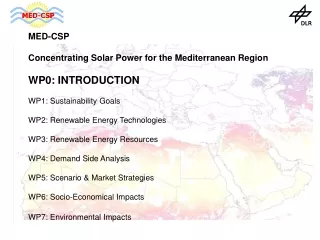
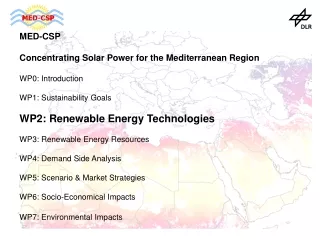
MED-CSP Concentrating Solar Power for the Mediterranean Region WP1: Sustainability Goals WP2: Renewable Energy Technologies WP3: Renewable Energy Resources WP4: Demand Side Analysis WP5: Scenario & Market Strategies (Energy) WP6: Socio-Economical Impacts WP7: Environmental Impacts
Energy Economic Frame Parameters of the MED-CSP Scenario The scenario departs from a crude oil price of 25 $/bbl in the year 2000, and equivalent prices for fuel oil (184 $/ton) and natural gas (6 $/GJ). These prices equal 15 $/MWh of thermal energy. The starting coal price in 2000 is 49 $/ton, equal to 6 $/MWh thermal energy. Escalation rates for all fuels were assumed to be 1 %/year. Considering today’s cost level of fossil fuels, this is a very conservative estimate. Higher fuel prices may be more realistic for the future. World fuel market prices are valid for all countries, even for those exporting fuels. This is due to the fact that in view of the strong growth of demand in the MENA countries, export of fuels will increasingly compete with domestic consumption. Fuel can be burned or sold, not both at the same time. National economies must subsequently calculate with world market prices if they burn fuel reducing their potential national income. It is an illusion to believe that domestic fuel is for free. Fuel that is burned for free is equivalent to the destruction of a national treasure. Even fuel potentials that would not justify the construction of an international market infrastructure (pipelines) due to their limited amount cannot be considered as for free, as they are obviously not sustainable and must be replaced soon, as domestic consumption growths. It is assumed that the European countries will introduce sequestration of greenhouse gases from flue gas of power generation after 2020, and will reach a sequestration share of 50 % of their conventional power generation by 2050. This will increase the cost of conventional power generation of newly installed plants or of plants with upgraded sequestration by about 2 c/kWh after 2020. MENA countries will probably not apply CO2 sequestration in the analysed time span. The electricity cost scenario was calculated with an average real discount rate of 5 %/year. All numbers are given in real values of $-2000. The electricity cost of renewable energies is calculated as function of the performance indicators and taking into consideration realistic learning effects by economies of scale and technical progress. Those learning curves refer to the specific investment per installed kWh and are shown in the respective diagram as a function of time. While most technologies show a degressive learning curve in terms of $/kW installed capacity, concentrating solar power shows a progressive curve. This is due to the fact that initial hybrid CSP plants will have a low solar share of 25 % which is subsequently increased to 95 % after 2020. For this purpose, larger collector fields and thermal energy storage facilities are needed within each plant, increasing its specific investment cost from 3000 $/kW in 2004 to about 4500 $/kW in 2020. Nevertheless, the electricity cost of CSP will be reduced steadily, because the plants will require less fuel for power generation and the collectors will become cheaper. CSP, geothermal power and biomass plants will subsequently take over backup capacity functions of conventional power plants. As they enter the intermediate and peak load power market, their annual full load hours will be reduced and their specific electricity cost will increase after 2040. This is not a problem, as the value of peak load electricity is also higher. Hydropower is already today used for peaking purposes, and its cost is relatively high due to that reason.
Barriers Limited Resources Market Expansion Limited Demand Market Limited Production Limited Finance Time Phase 1 Phase 2 Phase 4 Phase 3 Finding Renewable Energy Scenarios with the Crash-Barrier Principle: Subsequently, different factors limit technology expansion. Phase 1: Technology cost is high and expansion requires preferential investment Phase 2: Prices have become competitive but production capacities are limited Phase 3: Production catches up and the market is defined by demand Phase 4: As demand grows the availability of resources may become limiting
Synthesis of limits of power exchanges (MW) for year 2010 through the AC grid and example of improvements that can be achieved through defence plans /EURELECTRIC 2003/
Phase 3 Phase 1 Phase 2 Phases of CSP Market Introduction
1.6 MW 390 MW 68 MW 14600 MW Growth Rates of PV and Wind Power in Germany Source: Quaschning 2004
Life curve of remaining power plants in Morocco installed before 2003
Development of Fuel Prices ($-2004), Solar Share of CSP Plants and CO2-Sequestration Share of Fossil Power Generation in Europe within the MED-CSP Scenario
increased solar share Specific Investment of Power Technologies
Technical Frame Parameters of the MED-CSP Scenario Electrical Load: The maximum load is calculated in proportion to the growing electricity demand according to the scenario CG/HE. There are no inter-annual changes of the temporal structure of the load curve. The following figure shows the example of the peak load day for Egypt for the years 2001, 2020, 2030 and 2050. The power park is designed such that there is always a remaining reserve capacity of 25 % on peak power. Wind Power: Wind is a strongly fluctuating energy source that cannot be controlled by demand. However, distributed wind parks partially compensate each others fluctuations and show a relatively smooth transition. Depending on site, up to 15 % of the installed capacity can be considered as secured. Hourly wind data was taken from the World Wind Atlas. Photovoltaic : PV power is strongly fluctuating and only available during daytime. There is no contribution to secured power, but a good correlation with the usual daytime power demand peak of most countries. PV is specially suited for distributed power supply. Hourly global irradiance on a fixed tilted surface was taken from the Meteonorm database. Geothermal Hot Dry Rock: Geothermal power can be delivered on demand as base load, intermediate or peaking power using the earth as natural storage system. Unit sizes are limited to about 50 to 100 MW maximum. It can be used to compensate fluctuation from wind and pv-power. Biomass Power Generation: Biomass can deliver power on demand. However, biomass is scarce in MENA and subject to seasonal fluctuations. Biomass can be supplied in times when wind and pv power is low in order to compensate those sources, and shut down when wind and pv power is available to save the scarce biomass resources. Hydropower: The situation is similar for hydropower, which can be delivered on demand but is scarce in MENA and subject to seasonal fluctuations. If used only in times when pv and wind power are low, it acts like a natural complement and storage system for those resources. Hydropower is saved when wind and pv energy is available and preferably used during peaking periods, while its annual capacity factor remains more or less constant. Solar Thermal Electricity: Concentrating solar thermal power stations can deliver power on demand, making use of their thermal storage capability and hybrid operation with fuels. They are the natural link between the fossil system and the other renewables. Being the biggest resource, they will provide the core of electricity in MENA. Oil and Gas fired Power Plants: Oil and gas fired power plants are today the most applied technology in MENA. They will subsequently take over the part of closing the remaining gap between the load and the renewable power during peaking times. Their energy consumption will be reduced faster than their installed capacity. Coal Steam Plants Only a few countries in MENA use coal fired steam cycles. They constitute a feasible, however problematic supplement to power generation in MENA, as they are exclusively based on imports. Therefore, domestic sources like renewables, oil and gas will be the preferred choice in most MENA countries. Nuclear Fission and Fusion Nuclear plants are a fading technology with unsolved problem of nuclear waste disposal and high risk. In spite of massive subsidies, it has actually a market share of less than 1 %. Electricity from fusion will not be available before 2050.
MED-CSP Country Scenarios Electricity Generation: The European countries typically show rather large potentials of hydropower, wind power and biomass and less solar generation. This is due to the fact that solar collector production capacities are still small, and once they become visible after 2020, the electricity demand is already stagnating or retrogressive in those countries. Arab OPEC countries will probably maintain a rather high share of oil/gas for power generation and slowly change to solar schemes, while wind and hydropower are rather limited. All other MENA countries will increasingly make use of concentrating solar power as an ideal technology for a transition from an oil/gas fired power generation to a renewable energy driven scheme. Geothermal power is very promising in Saudi Arabia and Yemen. Although climate change and environmental considerations are very good reasons for a change to renewable electricity sources, the main issue is the security of supply and the cost of energy in the future. Most economies in MENA will not be able to develop properly in view of the increasing cost of fossil fuels. They are also those countries that will be most affected from climate change and desertification. Therefore, both economical and ecological considerations lead to a solar energy economy in the EUMENA region. Installed Capacity: The installed capacity of the total power park is calculated in a way that the national peak load is always covered with an additional minimum reserve of 25 % of secured installed power capacity. Due to the fact that wind and PV electricity shares only participate with a minor share in the provision of secured capacity, the total installed capacity tends to increase subsequently in relation to the national peak load. Typical capacity/peak load relations are today about 1.5 to 1.8, increasing to 1.7 to 2.5, respectively. While PV and Wind Power is resource driven, the other technologies can be applied in a demand driven manner. Hybrid CSP plants can deliver peak load, intermediate load and base load capacity on demand. Electricity Cost of New Plants: The cost of electricity from fossil plants is calculated with the average annual full load hours of each country’s power park and according to the relation of oil/gas and coal plants installed. The cost of new natural gas fired combined cycle power plants is displayed as well as the cost of steam-coal plants under the economic frame conditions shown before. The cost of fuel oil steam cycles is usually higher than those values. In Europe, the electricity cost of most renewable energies will cross the cost of fuel driven plants between 2010 and 2020. Most renewable power plants will be cheaper than new, fuel driven plants after that, specially if CO2-sequestration is introduced. But even in the MENA countries, where CO2 sequestration is not expected to become applicable, most renewable power plants will produce cheaper electricity than new fuel fired plants after 2020. CO2-Emissions: Specific CO2 emissions per kWh are calculated on the basis of average specific values that have been obtained from life cycle analysis of each power technology. For fuel power generation, the share of CO2 sequestration is considered. Most countries achieve the per capita emissions of clearly less than 1 t/cap/year in the power sector recommended by the German Scientific Council for Global Environmental Change (WBGU). Due to a general believe, this does not have to be financed by subsidies, but constitutes the most economic solution for a secure energy supply. However, it requires initial investments to start the technology learning curves of the renewable energy technologies and to achieve cost break-even with fossil fuels as soon as possible in order to relieve the national economies from subsidising the fossil fuel sector.
Electricity Generation & Installed Power Capacity of All Countries analysed within MED-CSP
Electricity generated by Renewable Energies (TWh/year) Biomass Geothermal
Electricity generated by Renewable Energies (TWh/year) Hydropower Wind Power
Electricity generated by Renewable Energies (TWh/year) Photovoltaics CSP Plants