Download

1 / 17
170 likes | 174 Views
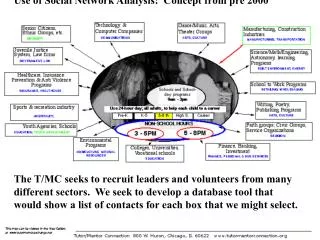
The Use of Social Network Analysis in Evaluation Design. Brian Zuckerman, Bhavya Lal, Alexis Wilson, Nathaniel Towery Science and Technology Policy Institute American Evaluation Association October 27, 2005. S T P I. Using Social Network Analysis (SNA) in evaluation design

E N D
The Use of Social Network Analysis in Evaluation Design Brian Zuckerman, Bhavya Lal, Alexis Wilson, Nathaniel Towery Science and Technology Policy Institute American Evaluation Association October 27, 2005 S T P I
Using Social Network Analysis (SNA) in evaluation design SNA for sampling SNA for pipeline evaluation design Tentative conclusions Overview
Social network analysis increasingly being used as tool for evaluating program outcomes Interdisciplinarity, collaboration, partnerships Features that make SNA effective outcome evaluation tool also valuable in designing evaluations Sampling for surveys, interviews, site visits Visualization of networks for pipeline evaluations Using Social Network Analysis in Evaluation Design
SNA for Sampling • Evaluations of R&D programs often require data collection from individual scientists/grants • Surveys, interviews, site visits • Often sampling frame is stratified based on demographic characteristics • Organizational affiliation, department, gender • Scientists, however, are not atomized – form “invisible colleges” through working relationships
SNA for Sampling (2) • Where evaluation designs require controlling for working relationships • Spread of information through a field or fields • Programmatic influence that may vary by subfield/subdiscipline • Using SNA as basis for stratifying population may be superior to relying solely on demographics of individual scientists
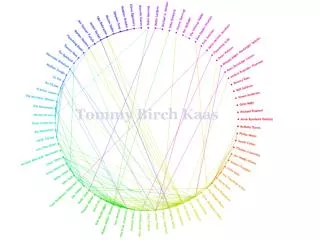
Program Evaluation Example: Spread of Methods Through Community • Formative evaluation partner of NSF-funded, large-scale Center award • Center/program goal to develop tools and methods that will diffuse throughout community • Evaluation design includes longitudinal surveys of scientists to assess use of concepts/tools and Center’s influence • Using SNA to visualize “community” and select survey sample
Sampling Frame: Demographic Representation Borgatti, S.P., M.G. Everett, and L.C. Freeman. 1999. UCINET 5.0 Version 1.00. Natick: Analytic Technologies.
Sampling Frame: Representation by Co-Authorship Borgatti, S.P., M.G. Everett, and L.C. Freeman. 1999. UCINET 5.0 Version 1.00. Natick: Analytic Technologies.
Sampling Frame: Key Nodes Identified Borgatti, S.P., M.G. Everett, and L.C. Freeman. 1999. UCINET 5.0 Version 1.00. Natick: Analytic Technologies.
SNA for Pipeline Evaluation Design • “Pipeline” evaluation concept • Programs may be locally optimal but globally suboptimal, leading to “leaks” from the pipeline, because of: • Poor articulation across programs/pipeline segments • Misdistribution of resources • Need instead to assess contribution of programs/organizations to overall flow through pipeline rather than contribution of each program individually • Network analysis as tool for visualizing pipeline first step in evaluation design
Pipeline Evaluation Example: “Translational” Biomedical Research • Flow of science from “bench to bedside” • Assessment of “translational” research by NIH Institute for strategic planning purposes • Balance between individual-investigator awards and large-scale Center-like programs • Design of future/desired pipeline • Portfolio of programs • Relationships between Institute and other stakeholders • Policies/regulations/structures to enhance translation • Reviews in past have used portfolio assessment methods to provide quantitative data for evaluation
Examples of Portfolio-Based Analyses Institute Historically Uses in Reviews We are using SNA to visualize entire translational research pipeline
SNA Allows for Representation of Pipeline “End to end” Centers program “End to end” Centers program Discovery Pre-clinical Clinical Trials Location on translational research continuum
SNA Allows for Representation of Pipeline “End to end” Centers program “End to end” Centers program Discovery Pre-clinical Clinical Trials Location on translational research continuum
SNA Allows for Representation of Pipeline Discovery Pre-clinical Clinical Trials Location on translational research continuum
Visualized Networks Will Be Assessed for Productivity and Efficiency Discovery Pre-clinical Clinical Trials Location on translational research continuum
Tentative Conclusions: SNA Methods Can Contribute to Evaluation Design • Potentially broad applications for sampling • Evaluations where communication/diffusion of information/collaboration key program element • Cross-sectional designs that require identification of "key nodes" of research activity • Growing sophistication of databases and tools reducing barriers • More specialized applications for pipeline evaluation • Assessment of flow across multiple stages/levels • Large-scale, mission-oriented vertically-integrated R&D organizations (e.g., DoD, NASA, large private companies) • Evaluation of STEM education/workforce programs • Requires integration of data across programs and levels – data generally not collected with pipelines or integration in mind