Download
1 / 28
280 likes | 284 Views
Access exclusive data, insights, and benchmarking reports to support strategic planning and improve transparency/accountability in higher education. Built by institutions for institutions, VSA Analytics offers unlimited users and customizable reports across enrollment, financial aid, price, student success, and expenditures.

E N D
Institutional Metrics Peer BenchmarkingStrategic Planning www.voluntarysystem.org
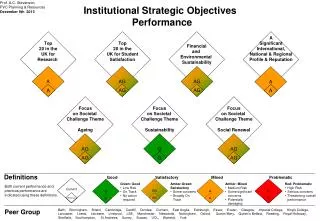
Origins of the VSATransparency/Accountability Strategic BenchmarkingNew Advisory Board StrategicPlanning Insight Data
VSA Analytics • 4 data sources • 9 years of trend reports • 350 variables • 4200 institutions
VSA Analytics • Built by institutions for institutions • Exclusive access • Subscription program • Unlimited users
VSA Analytics Main Menu • 25 reports – customize, print, and export • 5 categories • Enrollment • Financial Aid • Price • Student Success • Expenditures • 9 years of trend data: 2008-2017
A Public University in the Northeast • Compare enrollment growth against peers • To better serve the state • Compare to statewide peers
A public institution in the Midwest • Produces more degrees than many other institutions in the state • Continue to increase the number of degrees awarded • Improve educational attainment in the state
National Median Debt • Student debt is higher than it was in 2009 for all sectors • Started going down slightly since 2016 • Student debt associated with public institutions is considerably lower • Student debt for institutions that serve low SES or more part-time students is lower
4 year institutions that serve at least 25% Pell and 25% part time
A Public Institution in the South • Insight about graduation rates of African American students • Strategic focus on minority student success • African American Grad Rates were higher than the state average • Deconstructed the data uncovered a fact: • African American women had a higher graduation rate than the university average • Further analysis found that these women helped one another in their learning and created a community of support • Important information to • Support strategic mission • Present to the public • Share with the legislature
An HBCU in the East • Responding to legislative inquiries on graduation rates • IPEDS 6 year GR of FTFT is incomplete (38%) • An additional 9% of the first time full time cohort transferred out and graduated elsewhere • 47% of FTFT students completed in 6 years; 15 % still enrolled • 67% of Transfer Full-time cohort completed in 6 years • Right in the middle of HBCU’s who reported SAM nationally • Used to submit a “compelling” Annual Institutional Update report to the Middle States Commission on Higher Education
A Successful SAM Metric in the South • IPEDS 6 Year graduation rate = 35% • AND • 56% of the first-time full-time cohort successful completed within 6 years
In October • New Front End • New Functionality • More Data