Download
1 / 53
530 likes | 535 Views
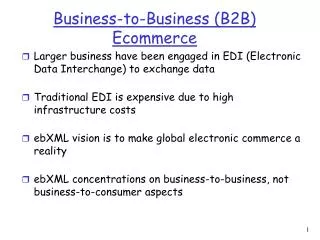
B2B e-business. 64157 电子商务模式设计与应用 国立中山大学企管所 2002 Spring, Week 3-3. 黄光彩 博士 太世科公司 2002/03/16. dot. Bomb has gone off. Shut Downs. 2000 Q1 / 2001 Major Internet Companies 222 147 Major E-Commerce Companies 120 63 Major Access Providers 18 16

E N D
B2B e-business 64157 电子商务模式设计与应用 国立中山大学企管所 2002 Spring, Week 3-3 • 黄光彩 博士 • 太世科公司 • 2002/03/16
dot.Bombhas gone off Shut Downs 2000 Q1 / 2001 Major Internet Companies 222 147 Major E-Commerce Companies 120 63 Major Access Providers 18 16 Major Content Sites 61 44 COM Source: webmergers.com
TheEvolution of the Internet Phase One:Portals EverywhereGoal: Presence Phase Two:Simple TransactionsGoal: Revenue Phase Three:Digital EconomyGoal: Profit
E-Businessparadigmsare changing Old Paradigm • .com / At All Costs • Presence • Wired New Paradigm • B2B / Reduce Costs • Personalization • Wireless 4
What’s accelerating theevolution of the new paradigms? • Lack of .com payoff • New wave of applications • Users demand interactive Web sites… across many devices, form factors and user interfaces • The wireless Internet Web content leads commerce. 5
The Edge Of The Network Where accessmeets infrastructureto deliver pervasive, personalized contentand commerce Applications Broadband Platforms Appliances Content Wireless 6
Question? What has become the principal driver of e-business investmentamong major corporations?
CIO survey— March, 2001 Cost cuttinghas become the principal driver of e-business investmentamong major corporations. Cost Control Boosting Revenue CRM Source: AMR Research, 2001
B2B • B2B/ Reducing Costs: • Adopting efficient B2B model • Industry E-Marketplace participation • Collaboration • .com / At All Costs • Internet Euphoria • Poor business models • Not concerned enough about profit • Fastest possible route, little attention to site architecture with scalability .com
cost savingsfrom Web-based Sales Model $500+ Cost Per Transaction $65 <$5 Web-based * Source Gartner
cost savingsfrom E-Procurement • 70% of time and money can be saved through online purchasing.* • Manual processing = $121, compared with only $33 for an online purchase** • Trimmed $2 millionfrom its procurement costs * Time & Money Purchase Order Cost Average Mid-size Company Impact * Source: Gartner - March, 2001 ** Source: Aberdeen Group - March, 2001
increaseduse of the Internet for Purchasing • 71% of companiesusing the Internet for purchasing — up from 61% last quarter • Currently transacting 9% of total procurementvia the Internet Source: The National Association of Purchasing Management (NAPM) & Forrester Research, 2001 12
B2B E-Commerce Is Multi-e-Channel US Business-to-Business E-Commerce (Billions) E-Markets lead growth Web EDI EDI DirectOver Web Internet E-Markets (XML) Extranets EDI viaInternet ETNs EDI viaVANs
B2B ValueDriver The Integrated e-business B2B is Here! Risk Integrated processes including partners and suppliers Value Maximum gain Enable Web-based transactions Real functional benefit Provide access to transactional data via the Web Publish information on the Web Some value Reward Low return
Today’s Situation EDI EDI Suppliers 25% Supplier A Phone Supplier B Fax 75% e-mail Supplier C • Majority of the human resource is used to manage 75 % suppliers who are not automated * • Initial investment to set up a 1-to-1 connection with EDI is too high for the majority of the suppliers to bear ($50 – $100k) • Not every supplier uses ERP/MRP systems • Fax, phone or e-mailare error prone & costlyto manage Source: Merrill Lynch
Supply Chain Opportunity Transportation Inventory Warehousing Administration 58% 11-15% of Revenue 30% 8% 3% Supply Chain Opportunity • 11% -15%cost per Transaction • Total = about 10% of GDP (US $921bn) Best-of-class companies can reduce overall supply chain costs by 6 to 8% Source: PRTM
History of Operational Efficiencies “IRP” Industry Resource Planning % of efficiencies ERP I-OPS Industry Operating System MRP Intra Company Inter Company 1980 1990 2000
The Network Effect of Marketplaces Without a Marketplace Without a Marketplace Without a Marketplace Sellers Buyers Sellers Buyers Sellers Buyers E-Procurement E-Commerce Buyers Sellers Market place
Global Mega e-Marketplaces • Pantellos: Mega-E-Marketplace for Utilities Industry • Hosted $100 million worth of auctions last month, yielding 20% cost savings for buyers • Sesami.net: Horizontal E-Marketplace in Japan • Processing $400 per month in transactions with 1500 buying organizations • Hosting integrated payment, logistics and value-added services for buyers • Simplexis: E-Marketplace for Education Industry • Purchase order costs reduced from $150 to $25 • Order delivery time reduced from 2-3 weeks to 1-2 days • Covisint • Driving to be the industry operating system for the automotive industry, offering a complete suite of applications and collaboration tools built around the automotive product lifecycle. • At the end of Q1, they completed their first million dollar WEEK in throughput on the e-marketplace. • DaimlerChrysler has conducted 27 events for online purchasing of nearly 500 parts using the Covisint exchange. The estimated material cost savings on parts purchased in those auctions exceeded 17 percent. • Siemens SPLS • Private e-marketplace (click2procure) • 75% reduction in processing costs, yielding a $25 cost reduction in requisition processing • 60% reduction in requisition-to-fulfillment cycles from one week to under 48 hours • Estimated yearly savings of $3.6 million in product costs alone
Example of e-marketplace customers • West LB: Regional e-marketplace in Germany • E-difica: A construction e-marketplace in Spain • Medicforma: E-Marketplace focused on the European medical community • Eutilia: E-Marketplace run by Europe’s leading utility companies • NAVSEA: E-Marketplace for Naval Sea Systems Command, will connect to Exostar • ChinaEB: First Regional E-Marketplace in China • Japan e-Market: E-Marketplace for the energy and utility industries in Japan • GoFish: E-Marketplace for the seafood industry
Net market makers • eSteel • Plasticsnet Venture funded start-up operating a public exchange Consortia Group of like players, typically focused on purchasing or selling • Covisint • Converge • Banyan Trade (Philipines) • Com2B (Taiwan) Three Business Models Business model Description Example • Cisco • Dell Supply chain or channel of a single large player Private exchanges B2B 2000
Marketplace liquidity numbers US$ Billions in 2000 Net market makers Consortia Private exchanges Intercontinental Exchange AltraMarket Place 300 Enron 20 NECX Intel Covisint Houston St. Exchange Cisco GNX Automated Power exchange IBM Predominantly auctions Dell Telcobuy FedEx Onvia* UPS Vertical Net* Ingram Micro Virtual Chip* Exchange Median 1 transaction/month Oct. 2000 Nortel Free Markets* Predominantly Web sales Tech Data SciQuest* * Annualized, based on Q3 00 data (Source: NMM.com) ** Data for 2001 B2B 2000 Source : Company websites, ZDNet, Giga, McKinsey analysis
The net market maker shakeout driven by lack of VC funding & incumbent skepticism Cumulative number of Net Market Makers Sample of 40 NMMs Examples Repositioned as a narrowly focused software/service provider • PlasticsNet • AviationX • SciQuest • MRO.com • Celarix • Partminer -70% Closed shop • Biz Buyer • Industrial Vortex • Food USA • Chemdex Merged with another exchange (startup, CBVM or private) • Converge and NECX • Bidcom and Cephren • Logistics.com and QuoteShip.com • MyAircraft.com and AirNewCo Jan 1999 Jan 2000 Jan 2001 Jan 2002 B2B 2000 Source : Gartner Group, McKinsey B2B database, McKinsey analysis
Most Consortia progress slower than planned Consortia killers Planned Actual • Only auctions are live • Slow, expensive integration to ERP • Prioritizing now could split up strategic alignment of members Broad array of 10-20 services • 3-5 suppliers in indirect goods • 2-3% user adoption within buying organization • Slow consortia progress favors go-it-alone ventures Gain ~25% of incumbent spend • Running out of cash; most need second round from incumbent participants • Hard to convince talent to join risky ventures • Incumbents focused on near-term bottom line; eB2B lower priority Become independently profitable company and IPO B2B 2000
Select fragmented market • Ensure incumbent has dominant position • Limit board size and put in place independent operational management team • Ensure incumbents adopt as standard • Enable user adoption and integration of key processes into legacy systems • Create win-win scenario to attract business partners • Focus on narrow slice of distinctive functionality • Drive supplier adoption • Focus on bottom-line impact KSF: Clear focus on customer value creation Private Exchanges Net market makers Consortia Relentless focus on value The Focus on Value
B2B shift to win-win value creation levers B2B of 2000 B2B of 2001/2 Functionality • Collaborative end-to-end value chain links such as design, sourcing, and sales/marketing • Match-making or transaction execution Types of interactions • Long-term, partnership-focused, value chain integration • One-off, arms-length Participants • Competitors in consortia • Supply chain partners Source of value • Collaborative process improvements impacting • Non price levers of total cost of ownership • Costs in multiple aspects of value chain • Market efficiency • Process standardization/ automation The Focus on Value
“e-Marketplace Value?” 54% Cost Reduction Automation of Business Processes Broadening of Customer/Supplier Reach Greater Accuracy Increased Productivity Improved Customer Relationship New Revenue Standardization Don’t Know 42% 36% 20% 16% 16% 12% 6% 2% % of 50 Global 2,000 Companies Involved in eBusiness(multiple responses accepted)
e-Marketplace Constituents Independent Trade Exchanges Operators Industry Consortia Private Exchanges Buyers e-Market Constituents Participants Sellers Business Technology Enablers Operating
e-Marketplace operators eMarket Operators Independent Trading Exchanges Industry Consortia Private Exchanges E-Market • Emerged first as intermediaries matching buyers and sellers • Often partnering with existing industry players for liquidity • Open access to the marketplace • Focus to date on matching buyers and sellers, expanding reach, transparency • A group of companies in the same industry join together • Typically interested in bringing together all industry participants • Focuses on deep integration between trading partners • Between a company and existing trading partners • Limited access to the marketplace • Focuses on deep integration between trading partners Definition • Cisco.com • DELL.net • GE Trading Partner Network • Walmart • Covisint (automobile) • e2Open (hi-tech) • Converge • Exostar (Aerospace & Defense) • Global Retail Exchange • Omninexus (Plastics) • ForestExpress • Rail Exchange • Transora (GMA members) • AltraEnergy • ChemConnect • Chipcenter • NECX • PlasticsNet • Questlink • VerticalNet Examples
Value Proposition High eCollaboration 3: Collaboration community-oriented services partnerships/alliances Supply chain S Exchange B Demand chain eOperational Execution 2:Process Integration visibility into internal processes/systems X S B Supply chain Demand chain Complexity / Community eCommerce 1: Order Regular Trans. = $125 to $175 Online Trans. = $10-$15 X S B Supply chain Demand chain High Interaction
eMarket Value Proposition Market • Improve transparency of pricing and product availability • Facilitate transaction execution • Document transactions electronically • Organize fragmented markets • Increase buyer discovery • Lower selling costs • Improve market intelligence • Dispose of excess material Supplier • Increase supplier discovery • Lower procurement costs • Aggregate volume • Measure supplier performance Buyer
e-MarketplaceLesson Learned • Demonstrate value early • Create incentives for commitment and participation • Offer more than just commerce • Ensure integration throughout the trading network • Build effective partnerships and alliances • Be flexible to adapt to changing market demands • Hire and empower an independent management team • “ Critical Mass & Liquidity”
Key differentiation for e-Marketplace • Personalization/Privatization • Business Process Standards • Aggregation/ Collaboration • Value Proposition • Trusted Environment • Business Model 34
OPEN MEMBERSHIP EQUAL ACCESS CONFIDENTIAL NON-EXCLUSIVE STANDARDS-BASED GLOBAL Issues 35
An Architecture Member Community Enterprise Relationship Portal Member Services • Trade • Auctions • Market Making • Catalog • Finance • Transport • In transit visibility • Rating/Routing • Compliance • Transact • One Connection • Non-EDI Suppliers • Trend • VMI Hubs • Demand/forecast • visibility • Team • Contents Mgmt. • BOM & part Validation • Cross enterprise design • collaboration Integrate B2B Layer Member Community 36
Value Range Service Offerings will start with Trade(using open market services), Knowledge(information enabler), Transport(logistics services), Transact(procurement), Trend(understand market demand, which reduce inventory costs), Teaming (vertical segmentation with outsourcing the manufacturing) The percentage indicates saving for using tomorrow’s e-business infrastructure 2-7% Manufacturing Costs Teaming Trend 2-3% Inventory Carrying Costs Transact 0.5-1% Procurement Spend Service Offerings Transport 2-3% Logistics Spend Knowledge Information Enabler Trade 1-2% Open Market Spend Today Tomorrow
Trade • Online trading (negotiations and auctions) • Offline trading • Global logistics and fulfillment • Business models • Quotation, Auction, Reverse Auction, Structured negotiation • Real-time market • Time-to-market 38
Transport • Transportation visibility • Freight aggregation • SMI (Supplier-Managed Inventory) visibility • VMI (Vendor-Managed Inventory) hub aggregation • Warehouse management • Reverse logistics • Collaborative Logistics Solution • End-to-end, Inventory alerting • Industry wide Network & VMI hub • Integration 39
What is Logistics? Logistics is defined as that part of the supply chain process that plans, implements, and controls the efficient, effective flow and storage of goods, services, and related information from the point of origin to the point of consumption in order to meet c??? • LOGISTICS world-wide : • over US $1 trillion per year • LOGISTICS in High-Tech : • $50B spent yearly on Logistics • $20B of High-Tech inventory is in-transit • 30-50 million inbound and outbound shipment transactions yearly
Transact • View order status • Create change orders • Receive advance ship notifications • (ASNs) • View invoice details • Cancel POs • Create advance ship notifications • Speed, CM(Contract Manufacturers, such as Solectron, Winstron, etc.), VMI • Supply Chain Partner Integration • Shipping information integration 41
Trend • Supply chain planning • Forecasting collaboration • Supply chain collaboration • Distribution planning • Forecast • Multiple Supply Chains, Inventory Visibility • Partner,Real-time monitoring & alerting 42
Teaming • Content management • BOM(Bill of Material) & part validation • Cross enterprise design collaboration • Design Team & Sourcing • Online Collaboration • Online Design Review 43
Knowledge • The Knowledge Marketplace • Member rating • Pricing and transaction history • Information services • Business intelligence • Knowledge management • Knowledge Management & Intellectual Property • Real time Market Access, Innovation & Collaboration 44
Connection • Connect kits • Certified SI(System Integration) partners • Methodologies • Opportunity assessment • Self profiling • MyMarket • Single log-on • Supply Chain Partner Integration & Interface • Real-time information Sharing, Supply Chain Visibility • Single log-on and personalization 45
Trend for Business Perspective Growing Stages of B2B e-Commerce Model B2B Commerce Model is evolving Buyer-Centric Model by basic EDI technology to e-Marketplace Model, which can transact through On-line. • Buyer needs to access each Supplier Sites (Lack of Searching information) • Reduce Procurement Cost • Enlarge Sales Opportunities • Community and Strengthen the transparency of Market • Delicate Technology, Various Standard • Inefficient Operation Cost * Source : Morgan Stanley
Trend for Business Perspective Via e-Hub which lead end-to-end integration, individual e-Marketplace will finally get the integrated structure of Market-to-Market linkage. M&A = Merger & Acquisition M2M = Marketplace to Marketplace thru e-Hub V1 H1 V2 H2+H3 V2 V1 V3 V3 V1 H1 M & A V2 M2M H2 H1 H3 V3 V1 H1 H2 V2 H2 e-Marketplace V3 V1 = Vertical Marketplace 1 H1 = Horizontal Marketplace 1 e-Hub
Trend for Technological Perspective XML is expected to be selected as basic-tools of web standardization due to the simple structure, the convenience of development and expansion capability. XML – Features SGML / HTML / XML SGML 1) HTML 2) XML complexity high low low • Separation of structure and expression • General-purpose • Easily learned • Highly expandable • Easily generated from DB • Standard Not dominated by Microsoft or Netscape • Vendor-free difficulty difficult easy easy Data-sharing yes no yes spec complex simple simple expansion yes Nonstandard expansion yes perspective CALS As Web-standard Notes: SGML 1) : developed in 1960s, selected as standard language in 1986(ISO8879) HTML 2) : developed in 1990, simple and easily usable
Trend for Technological Perspective XML can make business process more effective and simple. It helps to integrate multi-enterprise business and multiform business process. Practical usage of XML e-Marketplace XML / EDI • Linkage of e- Catalogue and XML/EDI • Integration of B2B support function • flexible definition on standard and management tool • Low cost XML e-Catalog EAI 1) • Organized documentation • Add flexibility to information management • Business application integration • Automated expression of complex structure Mobile(WAP) • Definition of Mark-up language for mobile internet environment • Browser and Gateway for Mobile Internet Notes: EAI 1) : Enterprise Application Integration
Trend for Technological Perspective Many institutes and Companies are trying to gain the initiative over XML standard, which is still under discussions. But ebXML is emerging as the strongest suggestion. Trend on XML Standard Foundation technology Controlling body Appropriate to Status Likely maturity date XML W3C All companies 2001 XML 1.0 Developed XML Schema and XML Query under development Frameworks: BizTalk Microsoft Small and medium-sized enterprises Draft 2.0 underdevelopment 2002 ebXML OASIS & UN/CEFACT Global 2,500 Began in Sep. 1999 Planned to complete ver. 1.0 within 18 months 2002 xCBL 2.0 Final Stage Focused on more specific field than others xCBL Commerce One Marketplaces and Global 2,500 procurement 2002 Process description languages BPMI.org Global 2,500 Began in Aug. 2000 2003 * Source:Forrester Research