Download
1 / 38
380 likes | 389 Views
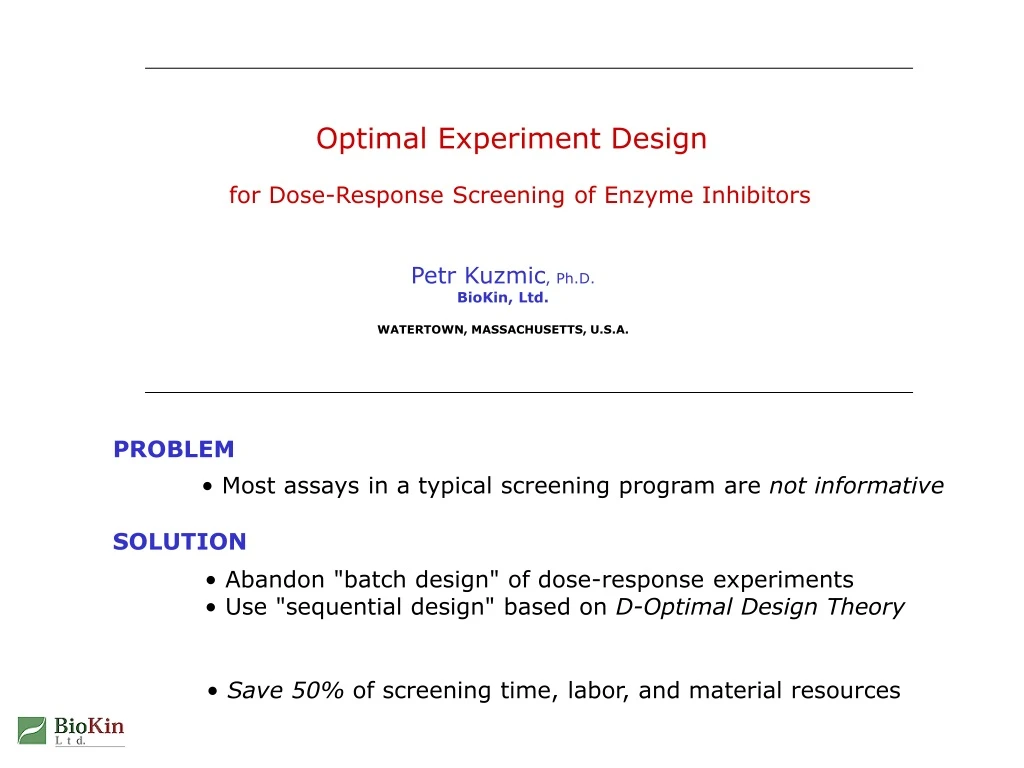
Optimal Experiment Design for Dose-Response Screening of Enzyme Inhibitors. Petr Kuzmic , Ph.D. BioKin, Ltd. WATERTOWN, MASSACHUSETTS, U.S.A. PROBLEM. Most assays in a typical screening program are not informative. SOLUTION. Abandon "batch design" of dose-response experiments

E N D
Optimal Experiment Design for Dose-Response Screening of Enzyme Inhibitors Petr Kuzmic, Ph.D.BioKin, Ltd. WATERTOWN, MASSACHUSETTS, U.S.A. PROBLEM • Most assays in a typical screening program are not informative SOLUTION • Abandon "batch design" of dose-response experiments • Use "sequential design" based on D-Optimal Design Theory • Save 50% of screening time, labor, and material resources
BATCHDESIGN OF EXPERIMENTS • decide beforehand on the design of a complete series of experiments • perform all experiments in the series without analyzing interimresults • analyze entire batch of accumulated data • issue final report SEQUENTIALDESIGN OF EXPERIMENTS • decide on the design of only one (or a small number of) experiment(s) • perform one experiment • analyze interim results; did we accumulate enough experiments? • if not, go back to step 1, otherwise ... • issue final report Two basic types of experiments BATCH VS. SEQUENTIAL DESIGN OF ANY RESEARCH PROJECT design = choice of screening concentrations Optimal Design for Screening
Analogy with clinical trials ADAPTIVE CLINICAL TRIALS (ACT): ADJUST THE EXPERIMENT DESIGN AS TIME GOES ON Borfitz, D.: "Adaptive Designs in the Real World" BioIT World, June 2008 • assortment of statistical approaches including “early stopping” and “dose-finding” • interim data analysis • reducing development timelines and costs byutilizing actionable information sooner • experts:Donald Berry, chairman of the Department of Biostatistics University of Texas MD Anderson Cancer Center • software vendors:Cytel, Tessela • industry pioneers:Wyeth 1997 “Learn and Confirm” model of drug development "slow but sure restyling of the research enterprise" Optimal Design for Screening
this point alonewould suffice toconclude: "no activity" to make sure,let's use two pointsnot just one What is wrong with this dose-response curve? THE "RESPONSE" IS INDEPENDENT OF "DOSE": NOTHING LEARNED FROM MOST DATA POINTS "control" data point: [Inhibitor] = 0 residualenzymeactivity log10 [Inhibitor] Optimal Design for Screening
these pointswould suffice these pointsare useless What is wrong with this dose-response curve? THE SAME STORY: MOST DATA POINTS ARE USELESS "control" data point: [Inhibitor] = 0 residualenzymeactivity log10 [Inhibitor] Optimal Design for Screening
Beat "the competition" to market. Publish your paper on time for grant renewal. Spend less on chemicals, hire a post-doc. Spend less on chemicals, hire a post-doc. Invent a drug, avoid closure of Corporate R&D. Invent a drug, get the Nobel Prize. Why worry about doing useless experiments? IN CASE THE REASONS ARE NOT OBVIOUS: Academia: • time • money • fame Industry: • time • money • security Optimal Design for Screening
On a more serious note... THERE ARE VERY GOOD REASONS TO GET SCREENING PROJECTS DONE AS QUICKLY AS POSSIBLE Leishmania majorPhoto: E. DráberováAcademy of Sciences of the Czech Republic Optimal Design for Screening
"Morrison equation" slope 1 Four-parameter logistic equation slope 2 "Hill slope" no clear physicalmeaning ! Theoretical foundations: The inhibition constant DO NOT USE IC50. THE INHIBITION CONSTANT IS MORE INFORMATIVE Kuzmič et al. (2003) Anal. Biochem.319, 272–279 Ki = [E]eq[I]eq /[E.I]eq Ki ... equilibrium constant E + I EI Optimal Design for Screening
Ki = 12 nM Ki = 9 nM Single-point formula: Ki = 11 nM Ki = 8 nM Theoretical foundations: The "single-point" method AN APPROXIMATE VALUE OF THE INHIBITION CONSTANT FROM A SINGLE DATA POINT Kuzmič et al. (2000) Anal. Biochem.281, 62–67 Relative rate Vr = V/V0 "control" V0 V [I] Optimal Design for Screening
EDITED BOOKS: • Endrényi(Ed.) (1981) "Kinetic Data Analysis: Design and Analysis of Enzyme and Pharmacokinetic Experiments" • Atkinson et al.(Eds.) (2000) "Optimum Design 2000" JOURNAL ARTICLES: • Thousands of articles in many journals. • Several articles deal with experiments in enzymology / pharmacology. Theoretical foundations: Optimal Design Theory NOT ALL POSSIBLE EXPERIMENTS ARE EQUALLY INFORMATIVE BOOKS: • Fedorov (1972) "Theory of Optimal Experiments" • Atkinson & Donev (1992) "Optimum Experimental Designs" Optimal Design for Screening
Fit data to nonlinear model: TWO OPTIMAL LIGAND CONCENTRATIONS (we need at least two data points): maximum feasible [Ligand] Optimal design of ligand-binding experiments SIMPLE LIGAND BINDING AND HYPERBOLIC SATURATION CURVES dissociationconstant Endrényi & Chang (1981) J. Theor. Biol.90, 241-263 SUMMARY: Kd • Protein (P) binding with ligand (L) P + L PL • Vary total ligand concentration [L] Observe bound ligand concentration [LB] Optimal Design for Screening
Fit data to nonlinear model: "Morrison Equation" TWO OPTIMAL INHIBITOR CONCENTRATIONS (we need at least two data points): control experiment (zero inhibitor) Optimal design of enzyme inhibition experiments THIS TREATMENT APPLIES BOTH TO "TIGHT BINDING" AND "CLASSICAL" INHIBITORS dissociationconstant Kuzmič (2008) manuscriptin preparation SUMMARY: Ki • Enzyme (E) binding with inhibitor (I) E + I EI • Vary total inhibitor concentration [I] Observe residual enzyme activity, proportional to [E]free Optimal Design for Screening
a model parameter ("final answer") we are trying to determine by the experiment ... being planned! A problem with optimal design for nonlinear models A CLASSIC CHICKEN & EGG PROBLEM PROTEIN/LIGAND BINDING Endrényi & Chang (1981) J. Theor. Biol.90, 241-263 ENZYME INHIBITION Kuzmič (2008) manuscriptin preparation We must guess the answer before we begin designing the experiment. Optimal Design for Screening
estimate Ki choose next concentration A solution for designed enzyme inhibition studies PUT TOGETHER OPTIMAL DESIGN AND THE SINGLE-POINT METHOD choose first concentration[I] collect single data pointat [I] single point method repeat optimal design theory Optimal Design for Screening
Sequential optimal design: Overall outline PUTTING IT ALL TOGETHER: "SINGLE-POINT METHOD" + OPTIMAL DESIGN THEORY FOR EACH COMPOUND: perform "preliminary" assays (n=3, sequentially optimized) detectable activity? NO Ki EXTREMELY TIGHT BINDING! YES perform "follow-up" assays (n = 2, batch) moderate activity ? NO Ki « [E] YES • add control point ([I] = 0) • assemble accumulated dose-response • perform nonlinear fit report best-fit value of Ki report"no activity" Optimal Design for Screening
Sequential optimal design: Preliminary phase ASSAY EVERY COMPOUND AT THREE DIFFERENT CONCENTRATIONS choose a starting concentration [I] measure enzyme activity at [I]: Vr=V[I]/V0 estimate Ki: completed three cycles? YES NO detectable activity? choose next concentration Optimal Design for Screening
Sequential optimal design: Follow-up phase WE DO THIS ONLY FOR EXTREMELY TIGHT BINDING COMPOUNDS (Ki << [E]tot) choose [I] = [E] optimal [I] at Ki approaching zero:[I]opt = [E] + Ki EXTRA POINT #1 measure enzyme activity at [I]: Vr=V[I]/V0 choose [I] = [E]/2 "rule of thumb" EXTRA POINT #2 measure enzyme activity at [I]: Vr=V[I]/V0 • combine with three "preliminary" data points • add control point ([I] = 0) • assemble accumulated dose-response curve • perform nonlinear fit ("Morrison equation") Optimal Design for Screening
Sequential optimal design: The gory details The actual "designer" algorithm is more complex: • We need safeguards against concluding too much from marginal data: - greater than 95% inhibition, or - less than 5% inhibition. • We need safeguards against falling outside the feasible concentration range. • We use other safeguards and rules of thumb. • The overall algorithm is a hybrid creation: - rigorous theory, and - practical rules, learned over many years of consulting work. Optimal Design for Screening
Anatomy of a screening campaign: Ki Distribution A REAL-WORLD SCREENING PROGRAM AT AXYSPHARMA (LATERCELERAGENOMICS) DATA COURTESY CRAIG HILL & JAMES JANC, CELERA GENOMICS PRESENTED IN PART (BY P.K.) AT 10TH ANNUAL SOCIETY FOR BIOMOLECULAR SCREENING, ORLANDO, 2004 • 10,008 dose response curves • Maximum concentration 0.5–50 µM • Serial dilution ratio 1:4 • Eight data points per curve • 3% Random error of initial rates • Enzyme concentration 0.6–10 nM completely inactive compounds (8%) positivecontrolon everyplate Optimal Design for Screening
Anatomy of a screening campaign: Examples A REAL-WORLD SCREENING PROGRAM AT AXYSPHARMA (LATERCELERAGENOMICS) no activity weak binding pKi = 4.5 Ki = 30 µM tight binding moderate binding pKi = 6 Ki = 1 µM pKi = 10 Ki = 0.1 nM Optimal Design for Screening
Monte-Carlo simulation: Virtual sequential screen SIMULATE A POPULATION OF INHIBITORS THAT MATCHES THE AXYS/CELERA CAMPAIGN PLAN OF A HEURISTIC MONTE-CARLO SIMULATION STUDY: • Simulate 10,000 pKi values that match Celera's "two-Gaussian" distribution • Simulate enzyme activities assuming 3% random experimental error • Virtually "screen" the 10,000 compounds using the sequential optimal method • Compare resulting 10,000 pKi values with the "true" (assumed) values • Repeat the virtual "screen" using the classic serial dilution method • Compare accuracy and efficiency of sequential and serial-dilution methods Optimal Design for Screening
Optimal Design Theory Ki = 0.18 µM EstimatedKi = 182 nM "Experimental"rate #2V/V0 = 0.554 Nextconcentration[I] = 147 nM Single Point Method Morrison Equation + RandomError Optimal Design Theory Ki = 0.18 µM "Experimental"rate #3V/V0 = 0.511 EstimatedKi = 191 nM Nextconcentration[I] = 183 nM Morrison Equation + RandomError Single Point Method Monte-Carlo study: Example 1 - Preliminary phase A TYPICAL MODERATELY POTENT (SIMULATED) ENZYME INHIBITOR "true" Ki = 181 nM "Experimental"rate #1V/V0 = 0.127 EstimatedKi = 146 nM Ki = 0.18 µM [I]= 1.0 µM Morrison Equation + RandomError Single Point Method [E] = 1 nM Optimal Design for Screening
Monte-Carlo study: Example 1 - Regression phase A TYPICAL MODERATELY POTENT (SIMULATED) ENZYME INHIBITOR - CONTINUED "true" Ki = 181 nM ASSEMBLE AND FIT DOSE-RESPONSE CURVE frompreliminaryphase [E] = 1 nM Rate 100 12.7 55.4 51.1 # 1 2 3 4 [I], µM 0.0 1.0 0.147 0.183 note negative control arbitrary initial [I] optimally designed [I] optimally designed [I] V0 = 100 Ki = (178 ± 9) nM fromnonlinearregression Optimal Design for Screening
Monte-Carlo study: Example 2 - Regression phase A TYPICAL TIGHT-BINDING (SIMULATED) ENZYME INHIBITOR "true" Ki = 0.021 nM ASSEMBLE AND FIT DOSE-RESPONSE CURVE frompreliminaryphase [E] = 1 nM Rate 100 -3.3 1.6 3.1 13.1 49.5 # 1 2 3 4 5 6 [I], µM 0.0 1.0 0.04 0.0016 0.001 0.0005 note negative control arbitrary initial [I] maximum jump 25 maximum jump 25 optimally designed rule of thumb V0 = 100 Ki = (0.033 ± 0.011) nM fromnonlinearregression Optimal Design for Screening
mM µM nM pM Ki Monte-Carlo study: "True" vs. estimated pKi values DISTRIBUTION OF "TRUE" pKi VALUES IS SIMILAR TO THE AXYS/CELERA CAMPAIGN SEQUENTIAL OPTIMAL DESIGN n = 3(or 5) + control Optimal Design for Screening
mM µM nM pM Ki Monte-Carlo study: Dilution series results DISTRIBUTION OF "TRUE" pKi VALUES IS SIMILAR TO THE AXYS/CELERA CAMPAIGN SERIAL DILUTION DESIGN n = 8 + control • [I]max = 50 µM • Dilution 4 • Eight wells Optimal Design for Screening
Efficiency of serial dilution vs. sequential design HOW MANY WELLS / PLATES DO WE END UP USING? SCREEN 10,000 COMPOUNDS (DOSE-RESPONSE) TO DETERMINE Ki's SERIALDILUTION SEQUENTIAL DESIGN SAVINGS total 96-well plates compounds per plate control wells per plate wells with inhibitors control wells ([I] = 0) total wells wells per compound 909 11 8 79992 7272 87264 8.73 343 88 8 30042 2744 32786 3.28 62.3 % 62.4 % 62.3 % 62.4 % 62.4 % Optimal Design for Screening
Toward optimized screening: Preliminary phase PROPOSAL FOR FULLY AUTOMATED OPTIMIZED SCREENING 1. Accumulate minimal (optimized) dose-response curves dispense optimal concentrations ROBOTliquidhandling PLATE READER reprogram robot for next plate export data ANALYSIS SOFTWAREfit dose-responsedetermine Ki OPTIMALDESIGNALGORITHM DATABASEstore/retrieveresults between plates COMPUTER SUBSYSTEM: INSTRUMENT-CONTROL & DATA-ANALYSIS Optimal Design for Screening
Efficiency comparison: ~100 compounds to screen HOW MANY WELLS / PLATES DO WE END UP USING WITH FEWER COMPOUNDS TO SCREEN? SCREEN 88 COMPOUNDS (DOSE-RESPONSE) TO DETERMINE Ki's SERIALDILUTION SEQUENTIAL DESIGN SAVINGS total 96-well plates compounds per plate control wells per plate wells with inhibitors control wells ([I] = 0) total wells wells per compound 8 11 8 704 64 768 8.73 3 88 8 264 24 288 3.27 62.5 % 62.5 % 62.5 % 62.5 % 62.5 % Optimal Design for Screening
SEQUENTIAL DESIGN All 88 inhibitors on every plate. 3 consecutive plates with progressively optimized concentrations. Example: Plate layout for 88 inhibitors HOW MANY WELLS / PLATES DO WE END UP USING WITH FEWER COMPOUNDS TO SCREEN? CT = control SERIAL DILUTION ..., 8 plates Inhibitors #1 through #11 Inhibitors #12 through #22 Etc., through #88 Optimal Design for Screening
Toward optimized screening: Data-analysis phase PROPOSAL FOR A FULLY AUTOMATED OPTIMIZED SCREENING 2. Analyze accumulated data ROBOTliquidhandling PLATE READER ANALYSIS SOFTWAREfit dose-responsedetermine Ki OPTIMALDESIGNALGORITHM DATABASEstore/retrieveresults between plates COMPUTER SUBSYSTEM: INSTRUMENT-CONTROL & DATA-ANALYSIS Optimal Design for Screening
Toward optimized screening: Current status THE WAY WE SCREEN TODAY: dispense arbitrary concentrations ROBOTliquidhandling PLATE READER programrobot HUMANOPERATOR ANALYSIS SOFTWAREfit dose-responsedetermine Ki Optimal Design for Screening
fewer experiments = better results("less is more") uncertainty of model parameters Optimal design in biochemistry: Earlier reports SEARCH KEYWORDS: "OPTIMAL DESIGN", "OPTIMUM DESIGN", "OPTIM* EXPERIMENT DESIGN" Franco et al. (1986) Biochem. J.238, 855-862 Optimal Design for Screening
Optimal experiments for model discrimination OPTIMAL DESIGN IS IMPORTANT FOR MECHANISTIC ANALYSIS Franco et al. (1986) Biochem. J.238, 855-862 try to decide onmolecular mechanism(e.g., competitive vs. non-competitive inhibition) optimal design Optimal Design for Screening
Integration with the BatchKi software THE BATCHKI SOFTWARE IS WELL SUITED FOR PROCESSING "SMALL", OPTIMAL DATA SETS • Automatic initial estimates of model parametersKuzmič et al. (2000) Anal. Biochem.281, 62-67 • Automatic active-site titration (for ultra-tight binding compounds)Kuzmič et al. (2000) Anal. Biochem.286, 45-50 • Automatic detection of chemical impurities in samplesKuzmič et al. (2003) Anal. Biochem.319, 272-279 • Automatic handling of outlier data points ("Robust Regression")Kuzmič et al. (2004) Meth. Enzymol.281, 62-67 • Handles enzyme inhibition and cell-based assays • Fifteen years of experience • Approximately 100,000 compounds analyzed by this consultant alone ALGORITHMStheoretical foundation Optimal Design for Screening
Disadvantages, limitations, and caveats: • works best for large number of compounds (n > 100) • has not been tested in practice • to avoid programming liquid handler manually, needs "closing the loop": robot reader computer Collaboration, anyone? Conclusions SEQUENTIAL OPTIMAL DESIGN FOR INHIBITOR SCREENING HAS BEEN TESTED "IN SILICO" Advantages of sequential optimal design: • reduce material expenditures by more than 50% • reduce screening time by more than 50% • increase accuracy & precision of the final answer (Ki) Optimal Design for Screening
Acknowledgments Craig Hill & James Janc Theravance Inc. South San Francisco, CA formerly Celera Genomics – South San Franciscoformerly Axys Pharmaceuticals formerly Arris Pharmaceuticals Optimal Design for Screening
Thank you for your attention • Questions ? • More info: www.biokin.com • Contact: +1 617 209 4242+1 617 209 1616 FAX BioKin Ltd | 15 Main Street Suite 232 | Watertown | Massachusetts 02472 | U.S.A. Optimal Design for Screening