Download
1 / 33
340 likes | 453 Views
A global Carbon Cycle Data Assimilation System (CCDAS) and its link to CAMELS. Marko Scholze 1 , Peter Rayner 2 , Wolfgang Knorr 3 , Thomas Kaminski 4 , Ralf Giering 4 & Heinrich Widmann 3 1 st CarboEurope Integration Workshop, Potsdam, 2004. 3. 1. 2. 4. Fast Opt. QUEST c.

E N D
A global Carbon Cycle Data Assimilation System (CCDAS) and its link to CAMELS Marko Scholze1, Peter Rayner2, Wolfgang Knorr3, Thomas Kaminski4, Ralf Giering4 & Heinrich Widmann3 1st CarboEurope Integration Workshop, Potsdam, 2004 3 1 2 4 FastOpt
QUEST c • QUEST is a newly, NERC funded directed programme (5 years). • QUEST aims to achieve a better qualitative and quantitative understanding of large-scale processes and interactions in the Earth System, especially the interactions among biological, physical and chemical processes in the atmosphere, ocean and land and their implications for human activities. • QUEST mainly focuses on: (1) the contemporary carbon cycle and its interactions with climate and atmospheric chemistry; (2) the natural regulation of atmospheric composition on glacial-interglacial and longer time scales; and (3) the implications of global environmental changes for the sustainable use of resources. • QUEST consists of a core team, strategic activities, fellowships, and collaborative grants. • QUEST website: http://quest.bris.ac.uk
CAMELS c CAMELS CAMELS Carbon Assimilation and Modelling of the European Land Surfacean EU Framework V Project (Part of the CarboEurope Cluster)
CAMELS CAMELS PARTICIPANTS (the “Jockeys”) • Hadley Centre, Met Office, UK – Coordinator: Peter Cox • LSCE, France • MPI-BGC, Germany • UNITUS, Italy • ALTERRA, Netherlands • European Forestry Institute, Finland • CEH, UK • IES/JRC, EC • FastOpt, Germany
CAMELS CAMELS AND INVERSE MODELLING • CAMELS Goals and General Strategy: Combining Inverse and Forward Model Strategies (material by Peter Cox, Hadley Centre) • Carbon Cycle Data Assimilation and Calculation of Uncertainties (CCDAS consortium)
CAMELS CAMELS Goals • Best estimates and uncertainty bounds for the contemporary and historical land carbon sinks in Europe and elsewhere, isolating the effects of direct land-management. • A prototype carbon cycle data assimilation system (CCDAS) exploiting existing data sources (e.g. flux measurements, carbon inventory data, satellite products) and the latest terrestrial ecosystem models (TEMs), in order to produce operational estimates of “Kyoto sinks“.
CAMELS CAMELS Motivating Science Questions • Where are the current carbon sources and sinks located on the land and how do European sinks compare with other large continental areas? • Why do these sources and sinks exist, i.e. what are the relative contributions of CO2 fertilisation, nitrogen deposition, climate variability, land management and land-use change? • How could we make optimal use of existing data sources and the latest models to produce operational estimates of the European land carbon sink?
CAMELS Inverse Modelling Method : Use atmospheric transport model to infer CO2 sources and sinks most consistent with atmospheric CO2 measurements. Pros : a)Large-scale; b) Data based (transparency). Cons : a)Uncertain (network too sparse); b) not constrained by ecophysiological understanding; c) net CO2 flux only (cannot isolate land management).
CAMELS Forward Modelling Method : Build “bottom-up” process-based models of land and ocean carbon uptake. Advantages : a)Include physical and ecophysiological constraints; b) Can isolate land-management effects; c) can be used predictively (not just monitoring). Disadvantages : a)Uncertain (gaps in process understanding); b) Do not make optimal use of large-scale observational constraints.
CAMELS The Case for Data-Model Fusion • Mechanistic Models are needed to separate contributions to the land carbon sink (e.g. as required by KP). • Large-scale data constraints (from CO2 and remote-sensing) are required to provide best estimates and error bars at regional and national scales. • Data-Model Fusion = ecophysiological constraints from forward modelling + large-scale CO2 constraints from inverse modelling
CAMELS CAMELS Flow Diagram
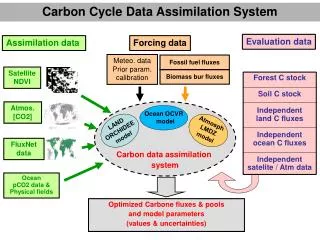
Combined ‘top-down’/’bottom-up’ MethodCCDAS – Carbon Cycle Data Assimilation System Misfit 1 CO2 station concentration InverseModeling: Parameter optimization Fluxes Model parameter ForwardModeling: Parameters –> Misfit Misfit to observations Atmospheric Transport Model: TM2 Biosphere Model: BETHY
CCDAS set-up • 2-stage-assimilation: • AVHRR data • (Knorr, 2000) • Atm. CO2 data • Background fluxes: • Fossil emissions (Marland et al., 2001 und Andres et al., 1996) • Ocean CO2(Takahashi et al., 1999 und Le Quéré et al., 2000) • Land-use (Houghton et al., 1990) Transport Model TM2(Heimann, 1995)
BETHY(Biosphere Energy-Transfer-Hydrology Scheme) lat, lon = 2 deg • GPP: C3 photosynthesis – Farquhar et al. (1980) C4 photosynthesis – Collatz et al. (1992) stomata – Knorr (1997) • Plant respiration: maintenance resp. = f(Nleaf, T) – Farquhar, Ryan (1991) growth resp. ~ NPP – Ryan (1991) • Soil respiration: fast/slow pool resp., temperature (Q10 formulation) and soil moisture dependent • Carbon balance: average NPP = b average soil resp. (at each grid point) t=1h t=1h t=1day b<1: source b>1: sink
Calibration Step Flow of information in CCDAS. Oval boxes represent the various quantities. Rectangular boxes denote mappings between these fields.
Methodology • where • is a model mapping parameters to observable quantities • is a set of observations • error covariance matrix need of (adjoint of the model) Minimize cost function such as (Bayesian form):
Calculation of uncertainties = inverse Hessian • Covariance (uncertainties) of prognostic quantities • Error covariance of parameters • Adjoint, Hessian, and Jacobian code generated automatically from model code by TAF
Gradient Method cost function J (p) 1st derivative (gradient) of J (p) to model parameters p: yields direction of steepest descent. 2nd derivative (Hessian) of J (p): yields curvature of J. Approximates covariance of parameters. Model parameter space (p) Figure from Tarantola, 1987
Seasonal cycle Barrow Niwot Ridge observed seasonal cycle optimised modeled seasonal cycle
Global Growth Rate observed growth rate optimised modeled growth rate Atmospheric CO2 growth rate Calculated as:
Parameters I • 3 PFT specific parameters (Jmax, Jmax/Vmax and b) • 18 global parameters • 57 parameters in all plus 1 initial value (offset)
Parameters II Relative Error Reduction
Carbon Balance Euroflux (1-26) and other eddy covariance sites* latitude N *from Valentini et al. (2000) and others net carbon flux 1980-2000 gC / (m2 year)
Uncertainty in net flux Uncertainty in net carbon flux 1980-200 gC / (m2 year)
Uncertainty in prior net flux Uncertainty in net carbon flux from prior values 1980-2000 gC / (m2 year)
NEP anomalies: global and tropical global flux anomalies tropical (20S to 20N) flux anomalies
IAV and processes Major El Niño events Major La Niña event Post Pinatubo period
Interannual Variability I Normalized CO2 flux and ENSO ENSO and terr. biosph. CO2: Correlations seems strong with a maximum at ~4 months lag, for both El Niño and La Niña states. Lag correlation (low-pass filtered)
Interannual Variabiliy II Lagged correlation on grid-cell basis at 99% significance correlation coefficient
Low-resolution CCDAS • A fully functional low resolution version of CCDAS, BETHY runs on the TM2 grid (appr. 10° x 7.8°) • 506 vegetation points compared to 8776 (high-res.) • About a factor of 20 faster than high-res. Version -> ideal for developing, testing and debugging • On a global scale results are comparable (can be used for pre-optimising)
Conclusions • CCDAS with 58 parameters can fit 20 years of CO2 concentration data; ~15 directions can be resolved • Terr. biosphere response to climate fluctuations dominated by El Nino. • A tool to test model with uncertain parameters and to deliver a posterior uncertainties on parameters and prognostics.
Future • Explore more parameter configurations. • Include missing processes (e.g. fire). • Upgrade transport model and extend data. • Include more data constraints (eddy fluxes, isotopes, high frequency data, satellites) -> scaling issue. • Projections of prognostics and uncertainties into future. • Extend approach to a prognostic ocean carbon cycle model.