Download
1 / 1
10 likes | 97 Views
Salinity-induced effects on transpiration rate, stomatal conductance and leaf area of three olive ( Olea europaea L.) varieties. 1 st. 2 nd. 3 rd. Renato Coelho 1,3 , Mário Moitas 2 , Ana Elisa Rato 1 , Margarida Vaz 1

E N D
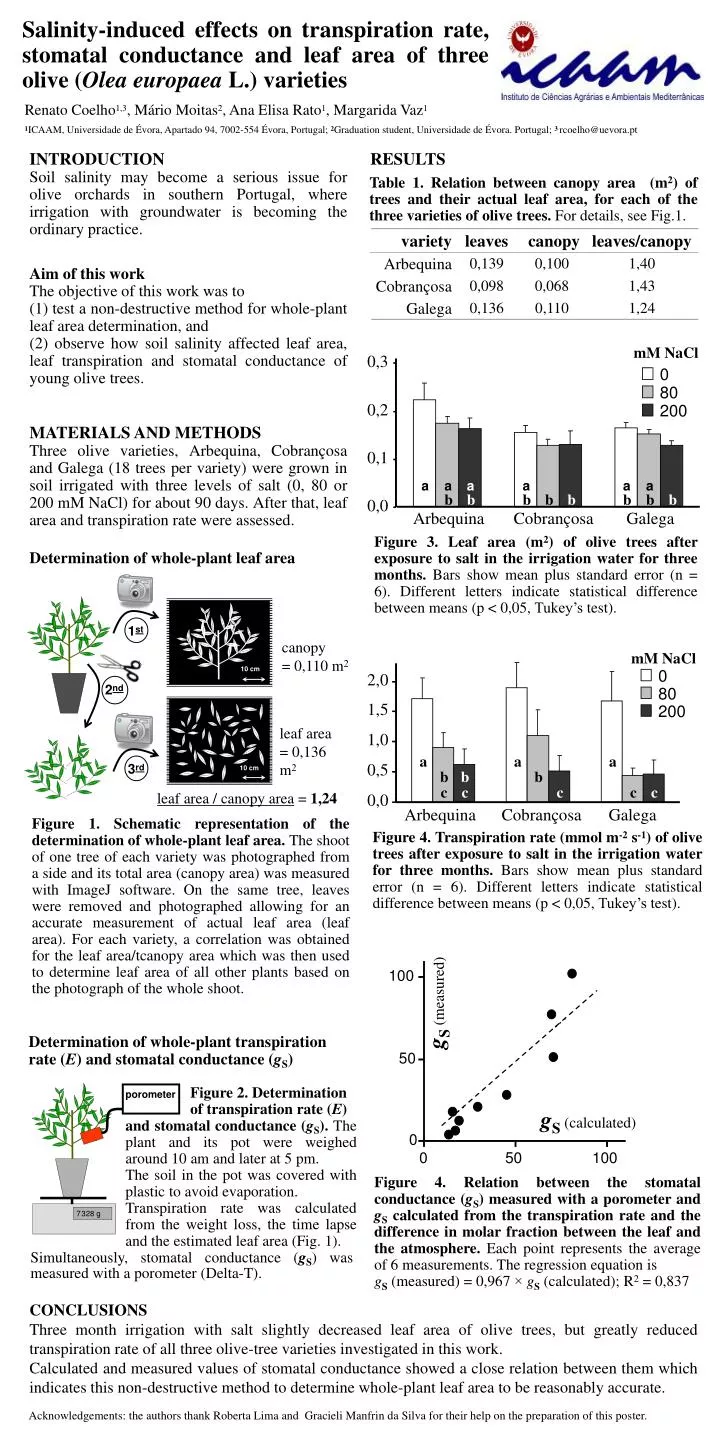
Salinity-induced effects on transpiration rate, stomatal conductance and leaf area of three olive (Olea europaea L.) varieties 1st 2nd 3rd Renato Coelho1,3, Mário Moitas2, Ana Elisa Rato1, Margarida Vaz1 1ICAAM, Universidade de Évora, Apartado 94, 7002-554 Évora, Portugal; 2Graduation student, Universidade de Évora. Portugal; 3 rcoelho@uevora.pt 7328 g INTRODUCTION Soil salinity may become a serious issue for olive orchards in southern Portugal, where irrigation with groundwater is becoming the ordinary practice. RESULTS Table 1. Relation between canopy area (m2) of trees and their actual leaf area, for each of the three varieties of olive trees. For details, see Fig.1. variety leaves canopy leaves/canopy Arbequina 0,139 0,100 1,40 Aim of this work The objective of this work was to (1) test a non-destructive method for whole-plant leaf area determination, and (2) observe how soil salinity affected leaf area, leaf transpiration and stomatal conductance of young olive trees. Cobrançosa 0,098 0,068 1,43 Galega 0,136 0,110 1,24 mM NaCl 0 80 200 0,3 MATERIALS AND METHODS Three olive varieties, Arbequina, Cobrançosa and Galega (18 trees per variety) were grown in soil irrigated with three levels of salt (0, 80 or 200 mM NaCl) for about 90 days. After that, leaf area and transpiration rate were assessed. 0,2 a a a a a a b b b b b b b b Determination of whole-plant leaf area Arbequina Cobrançosa Galega 0,1 Figure 3. Leaf area (m2) of olive trees after exposure to salt in the irrigation water for three months. Bars show mean plus standard error (n = 6). Different letters indicate statistical difference between means (p < 0,05, Tukey’s test). canopy = 0,110 m2 0,0 10 cm leaf area = 0,136 m2 mM NaCl 0 80 10 cm 200 leaf area / canopy area = 1,24 a a a b b b Figure 1. Schematic representation of the determination of whole-plant leaf area. The shoot of one tree of each variety was photographed from a side and its total area (canopy area) was measured with ImageJ software. On the same tree, leaves were removed and photographed allowing for an accurate measurement of actual leaf area (leaf area). For each variety, a correlation was obtained for the leaf area/tcanopy area which was then used to determine leaf area of all other plants based on the photograph of the whole shoot. c c c c c 2,0 Arbequina Cobrançosa Galega 1,5 Figure 4. Transpiration rate (mmol m-2 s-1) of olive trees after exposure to salt in the irrigation water for three months. Bars show mean plus standard error (n = 6). Different letters indicate statistical difference between means (p < 0,05, Tukey’s test). 1,0 0,5 0,0 100 gS (measured) Determination of whole-plant transpiration rate (E) and stomatal conductance (gS) Figure 2. Determination of transpiration rate (E) and stomatal conductance (gS). The plant and its pot were weighed around 10 am and later at 5 pm. The soil in the pot was covered with plastic to avoid evaporation. Transpiration rate was calculated from the weight loss, the time lapse and the estimated leaf area (Fig. 1). porometer 50 gS (calculated) Figure 4. Relation between the stomatal conductance (gS) measured with a porometer and gScalculated from the transpiration rate and the difference in molar fraction between the leaf and the atmosphere. Each point represents the average of 6 measurements. The regression equation is gS (measured) = 0,967 ×gS (calculated); R2 = 0,837 0 0 50 100 Simultaneously, stomatal conductance (gS) was measured with a porometer (Delta-T). CONCLUSIONS Three month irrigation with salt slightly decreased leaf area of olive trees, but greatly reduced transpiration rate of all three olive-tree varieties investigated in this work. Calculated and measured values of stomatal conductance showed a close relation between them which indicates this non-destructive method to determine whole-plant leaf area to be reasonably accurate. Acknowledgements: the authors thank Roberta Lima and Gracieli Manfrin da Silva for their help on the preparation of this poster.