Download
1 / 25
250 likes | 368 Views
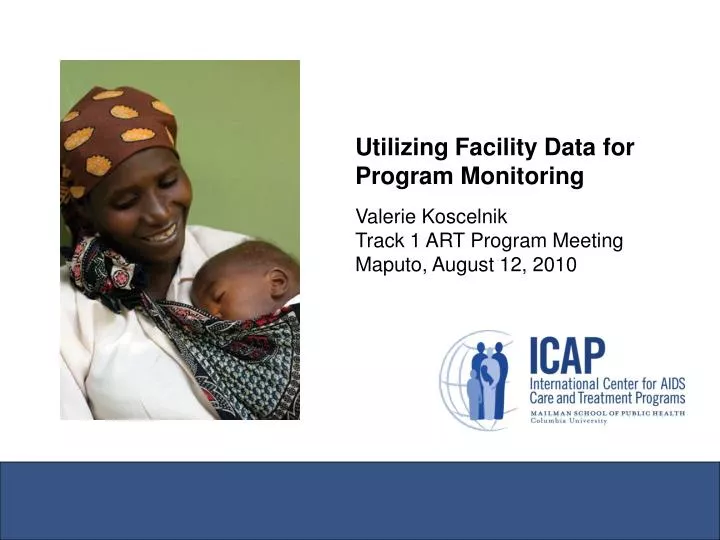
Utilizing Facility Data for Program Monitoring Valerie Koscelnik Track 1 ART Program Meeting Maputo, August 12, 2010. Outline. Framework for health system components and outcomes Transition short & long term goal/objective Transition Logic model Measurements: Site and Regional readiness

E N D
Utilizing Facility Data for Program Monitoring Valerie KoscelnikTrack 1 ART Program Meeting Maputo, August 12, 2010
Outline • Framework for health system components and outcomes • Transition short & long term goal/objective • Transition Logic model • Measurements: • Site and Regional readiness • Outcome indicators • Data quality assessments • Summary and conclusions
Health Systems Building Blocks and Key Health Outcomes Overall Health Outcomes
Transition monitoring: What are we looking for? Long term goal & shorter-term objective • Long term goal: sustained local ownership with maintenance of excellent patient care and good patient outcomes. Ultimately, a vision of an effective strengthened health systems. • Shorter term objective: Sites and local partners (governmental and/or NGO) able to accept/absorb and grow the program with delivery of high quality care Source: Transition Logic Model Working Group
The Transition Logic Model: Inputs &Outputs individualized per partner Transition Logic Model Inputs and outputs individualized per partner
Process/Health System Measurements • Site maturity: SCA-like tools • Technical and organizational competency of local government and NGO partners • Ownership – Performance & accountability documentation TBD Source: Transition Logic Model Working Group
Site readinessKenya • Locally developed site readiness tools assessing key domains ICAP-Kenya Track I Rapid Maturity Assessment Tool for Health Facility Transition: • Assessed (1) services offered, (2) HR, (3) general management, (4) financial management, (5) quality management (6) procurement/supply chain management and (7) performance indicator: retention of patients in last 12 month • Facility is ready for transition if scores 90% or greater • Facilities below 90% require continued capacity building for transition
State and site readiness:Nigeria • Structured assessment of state institutions and sites by (1) governance/leadership, (2) organizational structure, (3 & 4) HR & fin management, (5) external relationships, (6) service delivery, (7) pharmacy and (8) laboratory • Scale used to determine priority states for transition
Clinical Quality of CareOutcome indicators • Adult care and treatment • Pediatric care and treatment • PMTCT • TB/HIV • Laboratory • Counseling & Testing • Adherence and Psychosocial support Need to focus on priority set of key Quality of Care indicators
ICAP priority quality indicators: Standards of Care (SOC) Rationale: • Five priority quality indicators selected to allow for comparisons across sites, programs and countries* • Creates a limited, manageable core set of indicators for program monitoring and review of quality Data sources: • Routinely-collected site-level indicator data reported every quarter for HIV care and treatment (Track 1 reporting indicators), TB/HIV, and PMTCT programs • Data imported from country aggregate databases or hand-entered on on-line indicator database • Data checks are run on the data to ensure internal and cross-quarter consistency * Countries and site can select specific SOCs for monitoring & CQIactivities
Priority Indicator 1 Target: 95% of eligible patients in care and treatment receive cotrimoxazole • To start centrally collecting in fall 2010
Priority Indicator 2 Target: 95% of HIV infected children under one year of age receive ART
Priority Indicator 3 Target: 90% of patients enrolled into treatment remain in care for at least 12 months
Priority Indicator 4 Target: 95% of all patients in care and treatment receive TB screening at enrollment
Priority Indicator 5 Target: 95% of HIV-infected pregnant women in PMTCT services receive multi-drug ARV prophylaxis
Site specific trends in priority quality (SOC)indicators Mozambique
Site-specific trends in priority quality (SOC) indicators by siteRwanda
DQA Indicators * Quality Indicator
Summary • Readiness assessments critical to determine status of health system components and provide important information for transition preparation and monitoring • Quality indicator data at site and country levels provide critical outcome data on quality of health system outcomes before, during and after transition • Data quality audits are important and can serve to monitor performance and could inform continued funding and accountability
Conclusions Data must always inform programs Data must continue to inform all aspects of transition efforts