Download
1 / 28
760 likes | 2.42k Views
Epidemiological Study designs. Learning Objectives. Classification of Epidemiological Studies Recognize different study designs Define a Cross-Sectional study Ecological Studies Ecological Fallacy . Non Experimental Observational Studies. Experimental/ Interventional Studies.

E N D
Learning Objectives • Classification of Epidemiological Studies • Recognize different study designs • Define a Cross-Sectional study • Ecological Studies • Ecological Fallacy
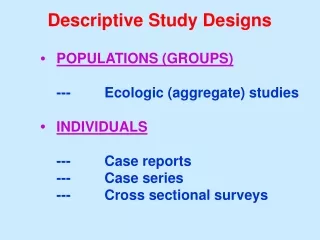
Non Experimental Observational Studies Experimental/ Interventional Studies Types of Epidemiological Studies Randomized Control trial or (Clinical trial) Non-randomized Quasi-Experimental Field trial Community Trial Individual Based Population Based Analytic (Ecological Study) Descriptive (Health Survey) Descriptive Case reports Case series Analytic Case-control study Or Case-reference Cross-sectional study Or Prevalence study Cohort study or Follow-up study
Descriptive vsAnalytic Epidemiology • Descriptive epidemiology deals with the questions: Who, What, When, and Where • Analytic epidemiology deals with the remaining questions: Why and How
Analytic Epidemiology • Used to help identify the cause of disease • Typically involves designing a study to test hypotheses developed using descriptive epidemiology
Types of Studies Two main categories: • Experimental • Observational • Experimental studies – exposure status is assigned • Observational studies – exposure status is not assigned
Observational Studies Three main study designs: • Cross-sectional study • Cohort study • Case-control study
Observational studies • Analytical • Cross Sectional • Cohort • Case Control Studies • Descriptive • Case report • Case series
Case Reports and Case Series • A detailed report by a physician of an unusual disease in a single person. • Population: unknown • Select patient: (case report) • or patients (case series) with disease of interest • Assessment: Describe clinical findings • Analysis: Radiographs, lab reports, etc • Interpretation: Special features of this disease • Example: “Normal plasma cholesterol in an 88-year-old man who eats 25 eggs a day” [Kern J, NEJM 1991; 324:896–899]12
Case Series and Case Reports • No comparison group! • Unusual/dramatic outcome (Phocomelia in offsprings of mothers receiving Thalidomide) • Sufficient for hypothesis generation (Need more studies)
Cross-sectional studies • Also called a prevalence study • Prevalence measured by conducting a survey of the population of interest e.g., • Interview of clinic patients • Random-digit-dialing telephone survey • Mainstay of descriptive epidemiology • patterns of occurrence by time, place and person • estimate disease frequency (prevalence) and time trends • Useful for: • program planning • resource allocation • generate hypotheses
Cross-sectional Studies • Select sample of individual subjects and report disease prevalence (%) • Can also simultaneously classify subjects according to exposure and disease status to draw inferences • Describe association between exposure and disease prevalence.
Examples • Prevalence of Asthma in School-aged Children in Lahore • Trends and changing epidemiology of hepatitis in Pakistan • Characteristics of teenage smokers in Multan • Prevalence of stroke in Gujranwala
Concept of the Prevalence “Pool” New cases Recovery Death
Cross-sectional Studies • Advantages: • quick, inexpensive, useful • Disadvantages: • uncertain temporal relationships • survivor effect • low prevalence due to • rare disease • short duration
Cross-sectional Study • Data collected at a single point in time • Describes associations • Prevalence • Burden of Disease A “Snapshot”
Cross-Sectional Study: Definition • Conducted at a single point in time or over a short period of time. No Follow-up. • Exposure status and disease status are measured at one point in time or over a period. • Prevalence studies. Comparison of prevalence among exposed and non-exposed.
Cross-Sectional Studies • Exposure and outcome status are determined at the same time • Examples include: • Behavioral Risk Factor Surveillance System (BRFSS) - http://www.cdc.gov/brfss/ • National Health and Nutrition Surveys (NHANES) - http://www.cdc.gov/nchs/nhanes.htm • Also include most opinion and political polls
Cross-sectional: Advantages • Usually use population-based samples, instead of convenient samples. Generalizability. • Conducted over short period of time • Relatively inexpensive
Cross-sectional: Disadvantages • Difficult to separate cause from effect, because measurement of exposure and disease is conducted at the same time. • A persons exposure status at the time of the study may have little to do with their exposure status at the time the disease began.
Ecologic Studies • Aggregates of individuals. • Aggregates often defined by units: geographic region, school, health care facility. • Does the overall occurrence disease in a population correlate with occurrence of the exposure. • No individual data
Ecologic Studies Use aggregate data, used primarily for hypothesis generation as opposed to hypothesis testing Examples of aggregate data: Disease rates (incidence, mortality, etc) Birth rates “Exposure” data: smoking rates, geographic residence, air pollution data, mean income, per capita consumption of saturated fats, proximity to nuclear power plants
Ecologic Fallacy • Grouped data do not necessarily represent individual level data Example: Fat intake and breast cancer rates with countries as the unit of measurement have consistently been found to be highly correlated. • But studies of individuals (cohort, case control studies) have not found any association with fat intake.
Why? • Possible reasons–countries with high fat intake are more likely to have other risk factors associated with breast cancer (i.e. late age at first pregnancy) • Or-- within population variability is low, but inter-population variability is high. • i.e. Extreme example– if everyone in a country had high fat intake, we would not be able to detect any excess because there would not be any population to compare them to with low fat intake
Examples • Ecological studies are useful for generation of hypotheses, supporting hypotheses, or for intervening at the population level. • Rates of stomach cancer declined dramatically after the advent of refrigeration in the 1930s– • Supports studies showing risk of stomach cancer increases with consumption of nitrates in preserved foods (sausage, lunch meat etc) • Smoking and lung cancer • Oral cancer and snuff use in the KPK
Summary • Descriptive Epidemiology • Answers: Who, what, where, when • Key Terms: Prevalence, person, place, time • Hypothesis-generating • Analytic Epidemiology • Answers: Why, how • Key Terms: Measure of association • Hypothesis-testing