Download
1 / 6
60 likes | 65 Views
This data analysis focuses on voltage control in transmission and generations buses. Graphs show the distribution of voltage percentiles and the minimum and maximum voltage values. Data is normalized for a control point of 1.0 per unit value. Based on one-minute PI data.

E N D
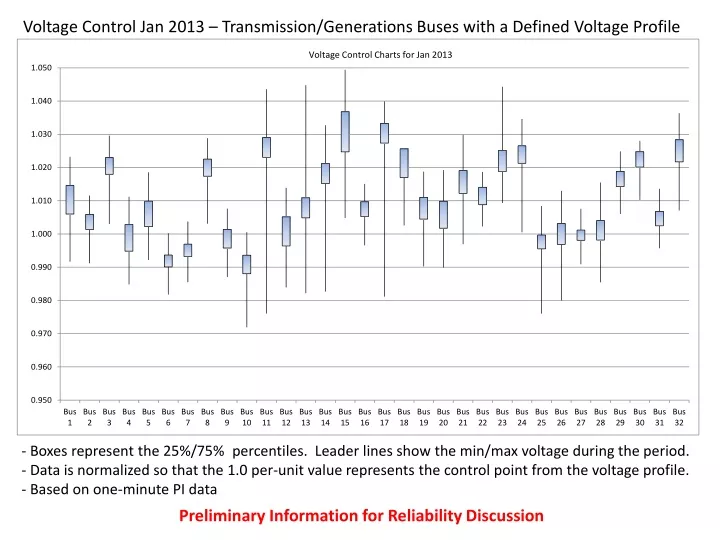
Voltage Control Jan 2013 – Transmission/Generations Buses with a Defined Voltage Profile - Boxes represent the 25%/75% percentiles. Leader lines show the min/max voltage during the period. - Data is normalized so that the 1.0 per-unit value represents the control point from the voltage profile. - Based on one-minute PI data Preliminary Information for Reliability Discussion
Voltage Control Jan 2013 – Transmission/Generations Buses with a Defined Voltage Profile - Boxes represent the 25%/75% percentiles. Leader lines show the min/max voltage during the period. - Data is normalized so that the 1.0 per-unit value represents the control point from the voltage profile. - Based on one-minute PI data Preliminary Information for Reliability Discussion
Voltage Control Apr 2013 – Transmission/Generations Buses with a Defined Voltage Profile - Boxes represent the 25%/75% percentiles. Leader lines show the min/max voltage during the period. - Data is normalized so that the 1.0 per-unit value represents the control point from the voltage profile. - Based on one-minute PI data Preliminary Information for Reliability Discussion
Voltage Control Apr 2013 – Transmission/Generations Buses with a Defined Voltage Profile - Boxes represent the 25%/75% percentiles. Leader lines show the min/max voltage during the period. - Data is normalized so that the 1.0 per-unit value represents the control point from the voltage profile. - Based on one-minute PI data Preliminary Information for Reliability Discussion
Voltage Control July 2013 – Transmission/Generations Buses with a Defined Voltage Profile - Boxes represent the 25%/75% percentiles. Leader lines show the min/max voltage during the period. - Data is normalized so that the 1.0 per-unit value represents the control point from the voltage profile. - Based on one-minute PI data Preliminary Information for Reliability Discussion
Voltage Control July 2013 – Transmission/Generations Buses with a Defined Voltage Profile - Boxes represent the 25%/75% percentiles. Leader lines show the min/max voltage during the period. - Data is normalized so that the 1.0 per-unit value represents the control point from the voltage profile. - Based on one-minute PI data Preliminary Information for Reliability Discussion