Download
1 / 21
210 likes | 464 Views
Large-Scale Distribution of Fine Aerosol Sulfate in the North American Arctic Basin During TOPSE. University of New Hampshire. Eric Scheuer Robert Talbot Jack Dibb Garry Seid Linsey Debell Barry Lefer (NCAR). THIS TALK. Instrument Overview

E N D
Large-Scale Distribution of Fine Aerosol Sulfate in the North American Arctic Basin During TOPSE University of New Hampshire Eric Scheuer Robert Talbot Jack Dibb Garry Seid Linsey Debell Barry Lefer (NCAR)
THIS TALK • Instrument Overview • Discussion of the Mist Chamber / Ion Chromatograph Technique for Aerosol Sulfate Analysis • Some Results from the NSF TOPSE Research Campaign
The University of New Hampshire Mist Chamber/Ion Chromatograph (MC/IC) instrument pulls air through a sample manifold at prescribed velocities depending on altitude. Air is then sub-sampled by nebulizing reflux concentrators (“mist chamber”) where the soluble aerosol sulfate is collected. The air velocity of the manifold and mist chamber are critical for the exclusion of super-micron particles. The now discrete sample is removed from the mist chamber by computer controlled syringe pumps (Kloehn 50300) and injected into custom fabricated ion chromatographs employing sample preconcentration (Dionex TAC-LP1). Separation is achieved using a carbonate/bicarbonate eluent and Dionex AS4A analytical columns. Background conductivity is suppressed using Dionex ASRS-Ultra suppressors. Detection is accomplished by a Dionex CD-20 detector equipped with a DS-3 temperature controlled cell. Digitized data is now sent to a data acquisition computer using standard ethernet communications where post processing takes place. Two independent systems operate in tandem allowing for continuous sampling with an average 2.5 minute time resolution.
The conventional technique for aerosol sulfate analysis uses Teflon air filtration to collect the sample. This technique has the capability to have multiple and varied analysis yielding more detectable species, but suffers from longer sample integration times and potential post collection handling artifacts. The MC/IC employed during TOPSE has many advantages including… • Faster response than conventional filter technique • No blank issues commonly associated with filter techniques • Near real-time data feedback • Sample and Fluid handling system are closed and isolated from aircraft cabin preventing contamination • Inlet is designed for a ~1m cutoff, excluding large particles
During the NASA/GTE PEM-Tropics B, we collected data for aerosol sulfate using both the Teflon filter technique and the MC/IC technique. The following shows filter data overlaid on MC/IC time series data collected for one flight on both the DC-8 and the P3-B. The red line represents sulfate on discrete filter samples and blue line represents MC/IC data collected. The filter data has been corrected for sea-salt sulfate and therefore represents primarily the fine fraction. Two things should be taken from this… -good agreement between the techniques -much faster time response for the MC/IC
During TOPSE, although not routinely collected, several bulk aerosol samples were collected at low altitude on Teflon filters (using the isokinetic aerosol probe installed for the collection of beryllium-7 samples). These samples were collected in order to facilitate speciation of soluble bromide observed in the MC/IC analysis. Aerosol sulfate was also quantified in these samples, providing a basis for comparison of TOPSE MC/IC samples with the conventional filter technique. The following is a comparison of sulfate values from filter analysis and MC/IC sample averages (and standard deviations) during filter collection time periods. Two points should be noted… - agreement between the techniques is good - filter samples generally exhibit slightly higher values, likely due to sulfate on the super-micron aerosol fraction more prevalent at the lower altitudes that these particular samples were collected. Although not presented here, PEM-Tropics B and TRACE-P data suggest agreement between the two techniques is even better at higher altitudes where sulfate is almost exclusively on fine particles
The following is the TOPSE deployment schedule (7 trips consisting of 42 science flights) along with number of discrete MC/IC samples generated. The 7 trips will later provide a natural delineation to show seasonal progression of the distribution in fine aerosol sulfate.
TOPSE deployment schedule and UNH sample counts Trip 1, February 4-9 (Flights 5-8) 268 samples Trip 2, February 21-27 (Flights 9-13) 502 samples Trip 3, March 5-8 (Flights 14-17) 288 samples Trip 4, March 19-26 (Flights 18-23) 655 samples Trip 5, April 2-7 (Flights 24-30) 712 samples Trip 6, April 23-30 (Flights 31-36) 703 samples Trip 7, May 15-23 (Flights 37-42) 692 samples 3820 samples This is the most extensive aerosol data set collected during an aircraft mission !
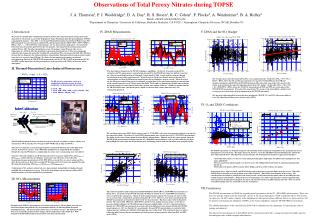
For a first look, we divide all the data into 3 altitude bins (less than 2000 meters, 2000-5000 meters, and greater than 5000 meters) and plot all of it versus latitude. Things to notice about these plots are… -There appears to be a increasing gradient of sulfate mixing ratios with latitude -There is a weak hint of a decreasing gradient of sulfate mixing ratios with altitude -There is a significant amount of “plume” data that could interfere with an analysis of “background” seasonality
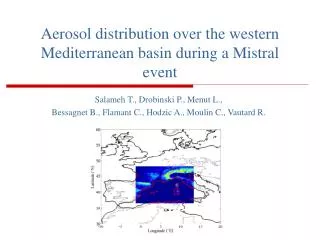
In order to facilitate an examination of the seasonality and structure of the sulfate data in the high arctic study region, we do several things… -Strip out data below 58o North as it not generally considered high Arctic and is highly influenced by local pollution events -Bin the data into seven 1000 meter altitude bins -Separate the data by trip (seven trips). -Calculate geometric means and sigma values since arithmetic means are overly sensitive to outliers or “plume” events -Plot these values versus altitude The following plot is an example of all the sulfate values (black) for trip 2 (flights 9-13) plotted with geometric means (and sigma's) of the values at the mean altitude of the 1000 meter bin (blue). Median sulfate values are are also presented (red). This plot clearly shows elevate mixing ratios during this trip at lower altitudes.
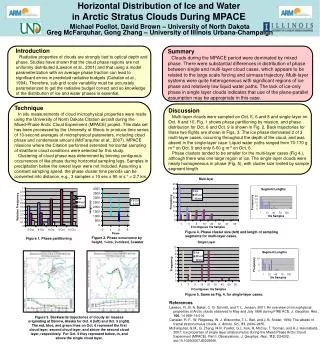
In order to examine the seasonal trend of sulfate during the TOPSE campaign (February-May), we plot geometric means of sulfate mixing ratios in their respective 1000 meter altitude bins for each trip in the sampling region north of 58o. Sigma's are removed for clarity. Several things should be noticed about these plots… -Sulfate mixing ratios are elevated and dramatically increasing in the lower troposphere during February through March. -Sulfate mixing ratios are also increasing at higher altitudes during the same time period -By April, sulfate mixing ratios are decreasing in the lower troposphere, but continue to increase in the upper troposphere -In May, sulfate mixing ratios are decreasing at all altitudes, but are still generally 2 times higher than in February. -The vertical gradient of sulfate mixing ratios noted in earlier trips is almost non-existent during the May trip.
Trip 1, Feb 4-9 Trip 2, Feb 21-27Trip 3, March 5-8 Trip 4, March 19-26Trip 5, April 2-7Trip 6, April 23-30 Trip 7, May 15-23
In order to demonstrate the nature of the winter time sulfate elevation in the high arctic, some data collected by Talbot et. al. during the 1988 GTE/ABLE 3A arctic campaign, is overlaid on the previous plot. Things to note about this include… -Sulfate appears greatly enhanced in the lower troposphere in spring when compared to summertime data from ABLE-3B -Through the time period of the TOPSE campaign, sulfate enhancement spreads upwards -The increasing trend in sulfate mixing ratios with altitude in these summertime measurements (opposite the general trends noted during TOPSE, especially in the earlier measurements) Measurements during other recent aircraft campaigns in the northern hemisphere during summertime and fall also show that winter/spring values measured during TOPSE are generally greatly elevated. These sulfate measurements made during TOPSE are consistent with and support the concept of arctic haze
We would like to acknowledge; -National Science Foundation (NSF) Office of Polar Programs (OPP) -National Center for Atmospheric Research (NCAR) -Research Aviation Facility (RAF)