Download
1 / 72
720 likes | 858 Views
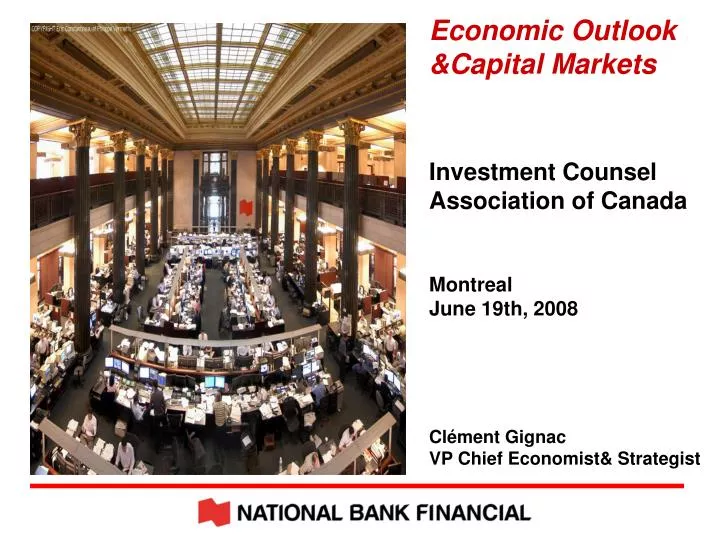
Economic Outlook &Capital Markets Investment Counsel Association of Canada Montreal June 19th, 2008 Clément Gignac VP Chief Economist& Strategist. Topics. U.S. recession in the offing: How long and deep? Emerging countries: How long will the decoupling with the U.S. last?

E N D
Economic Outlook &Capital Markets Investment Counsel Association of Canada Montreal June 19th, 2008 Clément Gignac VP Chief Economist& Strategist
Topics U.S. recession in the offing: How long and deep? Emerging countries: How long will the decoupling with the U.S. last? Canada: Our reasons to remain “cautiously optimistic” Capital markets: Where are we heading?
Disclaimer Parts of this presentation contain material that may not be suitable for some viewers. National Bank of Canada leaves it to the discretion of its clients whether or not to accept the implications of this scenario.
Part 1: The world has changed! A U.S. housing bubble pop and a halt to securitization activity! 4
Price of a single-family home as a ratio of median family income Ratio Average 1980-2000 NBF Economic Research, Federal Reserve
U.S. mortgage securitization activity suspended From 4% of GDP… Quarterly change in value outstanding ($ billion) …to -2.0% ! NBF Economy & Strategy (data via Federal Reserve)
A recipe for bubble creation by John Kenneth Galbraith (1972) Ingredients needed:1- Wall Street Financial Innovation (like CDOs now) 2- Easy access to credit (ex subprime mortgages)3- Lack of disclosure by participants (off balance sheet items) 7
U.S.: Precautionary increase in loan-loss provisions…As % of average assets, U.S. FDIC-insured institutions Source: FDIC
Risk aversion is back = ABCP are back on banks balance sheets Canada U.S. $ billions $ billions NBF Economy & Strategy
Citigroup share price Now playing at a Wall Street theatre:“The Survivor” Dividend cut predicted Dividend cut confirmed Meredith Whitney, Oppenheimer analyst
The Fed to the rescue:Sequence of non-traditional actions Dec 12, introduces the Term Auction Facility (TAF) and arranges currency swaps with ECB and Swiss National Bank, BoE and BoC. Dec 21, announces that TAF will continue for as long as needed. March 7, again increases the size of TAF and initiates term repos with primary dealers. March 11, upgrade its Term Securities Lending Facility, up to $200 billion of Treasury securities for 28 days against agency debt (Fannie Mae and Freddie Mac) or AAA MBS. Increases currency swap with ECB and SNB. March 16, cuts the discount rate by 25 bps after a Sunday meeting. Create a lending facility to US primary dealers for the first time since the Great depression on a backdrop of Bear Stearns rescue by JP Morgan … and do not exclude additional bold moves from the Fed
US: CRE concentration larger than everOne third of institutions with CRE loans more than 3 times equity % 33.4% FDIC-insured institutions with commercial real estate loans to total equity greater than: End of year 2008: As at March 31 Source: FDIC
Monetary Policy: Broken transmission mechanism? Spread Mortgage rate and government bonds Fed funds et Mortgage rates % Mortgage rate Basis points Fed funds
US Economic Outlook:Choosing between 4 scenarios? Sub par GDP growth (1966, 1986 or 1995 episodes) Recession (7 times over the last 50 years) Stagflation (a 1973-75 commodities like the 70’s) Depression (US in the 30’s and Japan in the 90’s) PS: As usual, we are trying to stay middle of the Road!!!
U.S. BUSINESS CYCLEThe real question is no longer whether or not the U.S. will go through a recession, but rather how long and deep it will be 16
U.S.: Consumers feel miserable Financial obligations and spending on energy as a % of disposable income Michigan sentiment survey and real wage bill* % (y/y) index % Wage bill(left) Michigan Sentiment(right) * Deflated with CPI inflation
U.S. households: Time to rebuild the savings rate? Rate of saving Home equity withdrawal as % of disposable income % % NBF Economic Research
US: 1% increase in unemployment rate usually heralds a recessionChange over 12 months % Global Insight
U.S.: Recessions could have different amplitude and duration Duration of GDP contraction Rise in unemployment rate Mean:9 months Mean: 2.6 pp Duration in Months Percentage points NBF Economy & Strategy (data from Datastream)
US: Unprecedented amount of rate cuts in a short period of time % 2-year Treasuries Fed funds NBF Economic Research, Datastream
The ongoing rates cuts, falling dollar and upcoming fiscal stimulus should prevent a deep and prolonged US recession… … at least for now as we believe oil price will return to $80 over the next 12 months U.S. Economy: Bottom line
Risk factor: Geopolitics in Middle East and higher oil prices OIL Price: Nominal and real $ Réel ($ de 2006) * Nominal
The U.S. is no longer the powerhouse of the global economy Part II: International The world has changed!
World economy: An ebbing of U.S. hegemony % of global GDP BRIC U.S. NBF Economic Research, IMF (World Economic Outlook, April 2008)
BRIC and Middle East account for half of global growth Over half of the 3.7% increase in world GDP in 2008 to come from emerging markets ! %, share of global GDP growth Advanced economies Emerging markets NBF Economic Research, IMF (World Economic Outlook, April 2008)
China: Industrializing very fast Percentage of population living in cities: China versus U.S. % of total population U.S. urbanization since 1840 Forecast for 2011 2004 2000 Every year more than 25 million Chinese people move to cities 1990 1978 NBF Economic Research, Census Bureau, China Statistical Yearbook
Commodities: A new paradigm or history likely to repeat itself
Any risk factors? Emerging countries theme
China: Will authorities be too complacent on growth? Elasticity ratio of energy consumption*:China vs. G7 economies CPI inflation: Emerging Asia vs. G7 economies % (y/y) Ratio (3-yr moving average) China G7 economies Emerging Asia G7 * Defined as the ratio of the growth rates in energy consumption and real GDP
Risk factor: Food prices % world population living in urban area CRB foodstuff index %
Leading indicators: Synchronized decline in momentum!!! BRICs World OECD
World GDP: Back to trend growth rate in 2008? Real world GDP growth Average 1970 – 2006 NBF economic research, IMF
Canadian Economy Why are we much more upbeat about prospects in Canada than in the USA?
Real estate: Canada not at risk according to the IMFIncrease in home prices over the period 1997-2007 not accounted by fundamentals House price gap (%) International Monetary Fund (April 2008)
Canada: Strongest public finances in the G-7Net government debt % of GDP NBF Economic Research, Finance Canada
Net exporter of resources = Surging terms of trade Ratio of export to import prices NBF Economic Research
External sector: Canadian surplus, U.S. deficit Current-account balance Foreign-held debt % of GDP % of GDP NBF Economic Research, Finance Canada
CAD closely ties to commodities CAD vs. CRB futures index USD/CAD CRB ijndec CAD/USD(right) CRB futures(left) NBF Economy & Strategy (data from Datastream)
Warning: Economics 101 Canada has great fundamentals but our economy will not be immune from a U.S. recession
GDP growth: Temporary soft-patch to be expected in 2008 Real GDP, 2008 forecast % Canadian average: 1.5% NBF Economic Research
Bottom line: BOC rate cuts not over yet in Canada % BoC overnight rate Fed funds rate NBF Economic Research, Datastream
Forecasts Indicators 2008 2009 GDP U.S. 1.4% 1.6% Canada 1.1% 1.9% Inflation U.S. 3.5% 1.9% Canada 2.2% 1.4% Current Jun. 2009 Policy rate U.S. 2.00% 2.00% Canada 3.00% 3.00% 10-year U.S. 4.19% 4.25% yield Canada 3.84% 4.02% CAD 1.016 0.92 S&PTSX 14,863 12,800
Capital markets: Volatility will remain for some time 49
Capital markets: Volatility is back in stocks and bonds!CBOE VIX and MOVE* indexes,40-week moving averages Index Index MOVE* index (L) VIX index (R) * Merrill Lynch trademark product Source: NBF Economic Research, Datastream