Download
1 / 1
10 likes | 94 Views
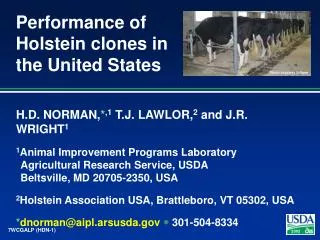
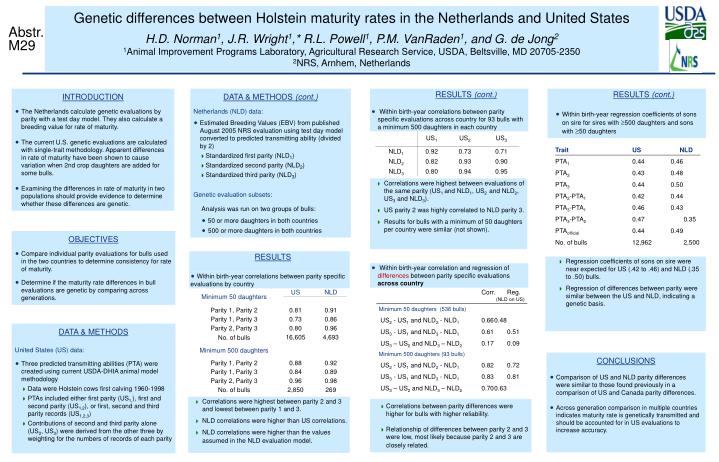
Genetic differences between Holstein maturity rates in the Netherlands and United States H.D. Norman 1 , J.R. Wright 1 ,* R.L. Powell 1 , P.M. VanRaden 1 , and G. de Jong 2 1 Animal Improvement Programs Laboratory, Agricultural Research Service, USDA, Beltsville, MD 20705-2350

E N D
Genetic differences between Holstein maturity rates in the Netherlands and United States H.D. Norman1, J.R. Wright1,* R.L. Powell1, P.M. VanRaden1, and G. de Jong2 1Animal Improvement Programs Laboratory, Agricultural Research Service, USDA, Beltsville, MD 20705-2350 2NRS, Arnhem, Netherlands Abstr. M29 INTRODUCTION • The Netherlands calculate genetic evaluations by parity with a test day model. They also calculate a breeding value for rate of maturity. • The current U.S. genetic evaluations are calculated with single-trait methodology. Apparent differences in rate of maturity have been shown to cause variation when 2nd crop daughters are added for some bulls. • Examining the differences in rate of maturity in two populations should provide evidence to determine whether these differences are genetic. DATA & METHODS (cont.) Netherlands (NLD) data: • Estimated Breeding Values (EBV) from published August 2005 NRS evaluation using test day model converted to predicted transmitting ability (divided by 2) • Standardized first parity (NLD1) • Standardized second parity (NLD2) • Standardized third parity (NLD3) Genetic evaluation subsets: Analysis was run on two groups of bulls: • 50 or more daughters in both countries • 500 or more daughters in both countries RESULTS (cont.) RESULTS (cont.) • Within birth-year correlations between parity specific evaluations across country for 93 bulls with a minimum 500 daughters in each country • Within birth-year regression coefficients of sons on sire for sires with 500 daughters and sons with 50 daughters TraitUS NLD PTA10.44 0.46 PTA2 0.43 0.48 PTA3 0.440.50 PTA2-PTA1 0.42 0.44 PTA3-PTA1 0.46 0.43 PTA3-PTA2 0.47 0.35 PTAofficial 0.44 0.49 No. of bulls 12,962 2,500 • Correlations were highest between evaluations of the same parity (US1 and NLD1, US2 and NLD2, US3 and NLD3). • US parity 2 was highly correlated to NLD parity 3. • Results for bulls with a minimum of 50 daughters per country were similar (not shown). OBJECTIVES • Compare individual parity evaluations for bulls used in the two countries to determine consistency for rate of maturity. • Determine if the maturity rate differences in bull evaluations are genetic by comparing across generations. RESULTS • Regression coefficients of sons on sire were near expected for US (.42 to .46) and NLD (.35 to .50) bulls. • Regression of differences between parity were similar between the US and NLD, indicating a genetic basis. • Within birth-year correlation and regression of differences between parity specific evaluations across country • Within birth-year correlations between parity specific evaluations by country Corr. Reg. (NLD on US) Minimum 50 daughters(536 bulls) US2 - US1 and NLD2 - NLD1 0.66 0.48 US3 - US1 and NLD3 - NLD1 0.61 0.51 US3 – US2 and NLD3 – NLD2 0.17 0.09 Minimum 500 daughters (93 bulls) US2 - US1 and NLD2 - NLD1 0.82 0.72 US3 - US1 and NLD3 - NLD1 0.83 0.81 US3 – US2 and NLD3 – NLD2 0.70 0.63 DATA & METHODS United States (US) data: • Three predicted transmitting abilities (PTA) were created using current USDA-DHIA animal model methodology • Data were Holstein cows first calving 1960-1998 • PTAs included either first parity (US1,), first and second parity (US1,2), or first, second and third parity records (US1,2,3) • Contributions of second and third parity alone (US2, US3) were derived from the other three by weighting for the numbers of records of each parity CONCLUSIONS • Comparison of US and NLD parity differences were similar to those found previously in a comparison of US and Canada parity differences. • Across generation comparison in multiple countries indicates maturity rate is genetically transmitted and should be accounted for in US evaluations to increase accuracy. • Correlations were highest between parity 2 and 3 and lowest between parity 1 and 3. • NLD correlations were higher than US correlations. • NLD correlations were higher than the values assumed in the NLD evaluation model. • Correlations between parity differences were higher for bulls with higher reliability. • Relationship of differences between parity 2 and 3 were low, most likely because parity 2 and 3 are closely related.