Download
1 / 22
240 likes | 278 Views
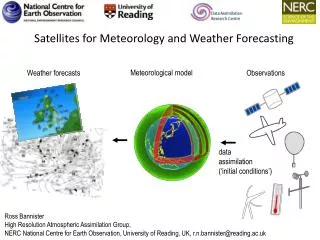
Satellites for Meteorology and Weather Forecasting. Meteorological model. Weather forecasts. Observations. data assimilation (‘initial conditions’). Ross Bannister, High Resolution Atmospheric Assimilation Group, NERC National Centre for Earth Observation, University of Reading, UK.

E N D
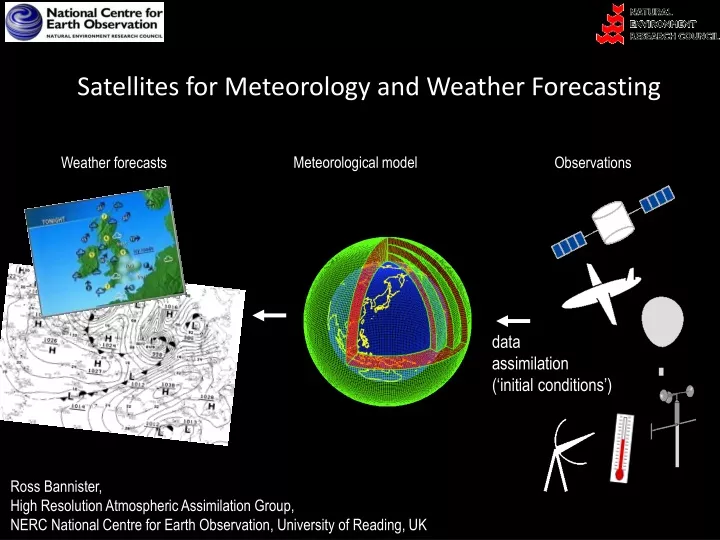
Satellites for Meteorology and Weather Forecasting Meteorological model Weather forecasts Observations data assimilation (‘initial conditions’) Ross Bannister, High Resolution Atmospheric Assimilation Group, NERC National Centre for Earth Observation, University of Reading, UK
How do satellites help in understanding and forecasting weather events? There is a huge demand for up-to-date knowledge about the Earth system Issues with use of satellite data for numerical weather prediction (NWP)
Types of weather measurements not comprehensive! 'Rad'=radiances, 'MW'=microwave, 'IR'=infrared, 'Vis'=visible In operational global weather forecasting there are ~106 observations assimilated per cycle
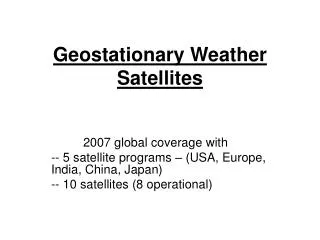
A history of satellites for weather forecasting not comprehensive! 1978 – MeteoSat (geostationary) 2004 – MeteoSat SG (geostationary) 1966 – ATS (geostationary) 1974 – SMS (geostationary) Apr 1960 – TIROS 1 Aug 1959 – Explorer 6 Feb 1959 – Vanguard2 1969 – Nimbus 3 2006 - MetOp First picture of Earth from TIROS-1
www.sat.dundee.ac.uk Sequences of satellite pictures (visible) SEVIRI channel 1, 0.56 – 0.71 μm Courtesy NERC Satellite Receiving Station, University of Dundee
Information from satellite measurements over other parts of the EM spectrum 12.0 µm - information on temperature near the surface to ~3 km 9.7 µm - information on temperature at ~13 km ‘radiance’ measured by satellite Thermal emission from body at 300K 7.3 µm - information on temperature at ~3 to ~8 km surface Wavelength 10-6 m (µm)
www.sat.dundee.ac.uk Sequences of satellite images (visible + infrared) SEVIRI channel 1, 0.56 – 0.71 μm SEVIRI channel 10, 11 –13 μm Courtesy NERC Satellite Receiving Station, University of Dundee
www.sat.dundee.ac.uk Sequences of satellite images (visible + infrared + water vapour) SEVIRI channel 1, 0.56 – 0.71 μm SEVIRI channel 10, 11 –13 μm SEVIRI channel 6, 6.85 –7.85 μm Courtesy NERC Satellite Receiving Station, University of Dundee
Orbit configurations 12 • Polar orbit • 600-800 km above sea level typically. • Near-global coverage over time. • Non-continuous sampling of a given location. • Often used for sounders (e.g. on board EnviSat, EOS Aura, etc). • Geostationary orbit • • 35 786 km above sea level, latitude 0.0°. • • View 1/4 of Earth's surface (60S-60N). • • Continuous sampling of a given location. • • Often used for imagers (e.g. on board MeteoSat, etc). • • Horiz. resolution degrades poleward.
Viewing geometries Limb • Good vertical resolution possible (~1km). • Poor horizontal resolution. • Used mainly in research. Nadir • Good horizontal resolution possible. • Poor vertical resolution (several km). • Used mainly in operational weather forecasting.
Satellite ‘imagers’ vs ‘sounders’ • Imager: • An instrument that measures a signal with spatial resolution. • On board geostationary and polar orbiting satellites. • Nadir viewing only. • Sounder: • An instrument that measures a signal with spectral resolution. • On board mainly polar orbiting satellites. • Nadir or limb viewing. • Can be processed to give quasi-height resolved retrievals of T, q, O3, etc. (used heavily for numerical weather prediction).
Selection of instruments not comprehensive! List of more acronyms at www.met.rdg.ac.uk/~ross/DARC/Acronyms.html
Other types of satellite instrument Scatterometer Radio occultation
Example imagery – polar lows 06/04/2007, MODIS 21/07/2007, MODIS Courtesy NERC Satellite Receiving Station, University of Dundee
Example imagery – frontal systems 05/09/2008, AVHRR 31/01/2008, MODIS Courtesy NERC Satellite Receiving Station, University of Dundee
Example imagery - thunderstorms 30/10/2008, AVHRR 24/04/2008, MODIS Courtesy NERC Satellite Receiving Station, University of Dundee
Example imagery - hurricanes 29/08/2005, GOES-E 19/08/2009, GOES-E Courtesy NERC Satellite Receiving Station, University of Dundee
Example imagery - anticyclones 09/12/2001, MODIS 21/09/2006, MODIS Courtesy NERC Satellite Receiving Station, University of Dundee
Deriving useful information from satellite data compare simulated with measured spectra Measured brightness temperature (K) Simulated brightness temperature (K) wavenumber (cm-1) wavenumber (cm-1) simulate spectrum adjust atmospheric profiles for greater agreement (retrieval / assimilation theory) Estimation of atmospheric state refined with information from measured spectrum Temperature water vapour O3
Courtesy NERC Satellite Receiving Station, University of Dundee SEVIRI channel 6, 6.85 –7.85 μm Ref: From Sputnik to EnviSat, and beyond: The use of satellite measurements in weather forecasting and research Brugge & Stuttard, Weather 58 (March 2003), 107-112; Weather 58 (April 2003), 140-143.