Download
1 / 20
200 likes | 206 Views
Forecasting 3 Regression Analysis Ardavan Asef-Vaziri. Regression Analysis. The primary method for associative forecasting is Regression Analysis. T he relationship between two or more variables. The relationship could be linear or non-linear .

E N D
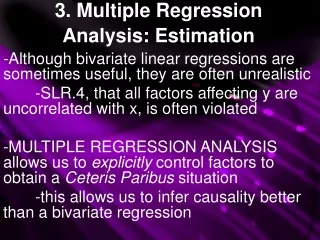
Regression Analysis • The primary method for associative forecasting is Regression Analysis. • The relationshipbetween two or more variables. • The relationship could be linear or non-linear. • Simple Linear Regression : Linear Regression Between Two Variables • We could use available data to investigate such a relationship. We use this relationship to forecast future. • The relationship between a dependent variable and one or more independent variables. The independent variables are also referred to as predictor variables. • We may use regression to investigate the relationship between demand (y) and time (x), or advertisement (x) as independent variable and sales (y) as the dependent variable.
b1 1 b0 Graphical - Judgmental Solution
b1 > 0 b1 < 0 b1 = 0 Simple Linear Relationship Linear relationship between two variables is stated as y = b0 + b1 x y: Dependent variable x: Independent variable b0: Intercept with y axis b1: Slope of the line
The Correlation Coefficient • Correlation coefficient is a measure of the strength of a linear association between two variables. It has a value between -1 and +1 • Rxy= +1: two variables are perfectly related through a line with positive slope. • Rxy= -1: two variables are perfectly related through a line with negative slope. • Rxy= 0: two variables are not linearly related. Coefficient of Determination and Correlation Coefficient are both measures of associations between variables. Correlation Coefficient for linear relationship between two variables. Coefficient of Determination for linear and nonlinear relationships between two and more variables.
Regression in Excel This is an unedited in-class recording
Regression Output Correlation Coefficient +↑. Close to + 1 Coefficient of Determination ↑ Close to 1 Standard Deviation of Forecast ↓ If the first period is 1, next period is 10+1 = 11 P-value ↓ less than 0.05
Regression Output Ft = 94.13 +30.71t What is your forecast for the next period. F11 = 94.13 +30.71(11) = 431.7 Mean Forecast = 431.7, Standard Deviation of Forecast = 22.21
Regression Problem 1 What is your forecast fore the next period? In which period are we? 7. Next period is 8. Standard Deviation of Forecast = 2.09
Regression Problem 2 Given the following regression report for the relationship between demand and time. (Demand is the dependent variable and Time is the independent variable) • What is your forecast for the next period? • 52+10(20+1) = 262 • What is the standard deviation of your forecast for the next period? 15.05 • Is there a strong relationship between the dependent and the independent variables? • Yes R-Square (Coefficient of Determination) id 0.95, Multiple R (Correlation Coefficient) is 0.97, p-value is very small • Is the relationship positive or negative? • Positive. We can check it by Multiple R being + or b1 being +
Short Questions 1-2 • 1. If the coefficient of determination between interest rate (x) and residential real estate prices (y) is 0.85, this means that: • A) 85% of the y values are positive • B) 85% of the variation in y can be explained by the variation in x • C) 85% of the x values are equal • D) 85% of the variation in x can be explained by the variation in y • E) none of the above • 2. Which value of the coefficient of correlation (r) indicates a stronger correlation than 0.7? • A) 0.6 • B) -0.9 • C) 0.4 • D) -0.5 • E) none of the above
Short Questions 3-4 • 3. In a good regression we expect • P-value to be high and R-square to be high • P-value to be low and R-square to be low • P-value to be low and R-square to be high • P-value to be high and R-square to be low • none of the answers 4. Discuss the relationship between MAD in moving average and exponential smoothing and Standard Error in regression. Standard Error in regression is an estimate of the Standard Deviation of the Forecast. Standard Deviation of the Forecast = Standard Error MAD in moving average and exponential smoothing is an estimate of the Standard Deviation of the Forecast. Standard Deviation of the Forecast = 1.25MAD
Mathematical Solution ^ |y9 – y9|
y10- yi y SST : Pictorial Representation
SSE , SST and SSR SST : A measure of how well the observations cluster around y SSE : A measure of how well the observations cluster around ŷ If x did not play any role in vale of y then we should SST = SSE If x plays the full role in vale of y then SSE = 0 SST = SSE + SSR SSR : Sum of the squares due to regression SSRis explained portion of SST SSE is unexplained portion of SST
Coefficient of Determination for Goodness of Fit SSE = SST - SSR The largest value for SSE is SSE = SST SSE = SST =======> SSR = 0 SSR/SST = 0 =====> the worst fit SSR/SST = 1 =====> the best fit Correlation Coefficient = Sign of b1 times Square Root of the Coefficient of Determination)
Additional Resources For Simple Regression, you may watch the Following Video https://www.youtube.com/watch?v=i2bqvDRapxo For Multiple Regression, you may watch the Following Video https://www.youtube.com/watch?v=HgfHefwK7VQ