Download
1 / 33
330 likes | 340 Views
This presentation discusses the work carried out at the Jet Propulsion Laboratory, California Institute of Technology, sponsored by NASA's Office of Safety and Mission Assurance. The objective is to gain a better understanding of the effects of requirements changes on fault content and to develop a method of infusing measurement and fault modeling techniques into software development environments. The presentation covers goals, approach, status, current results, and papers and presentations resulting from this initiative.

E N D
Infusing Software Fault Measurement and Modeling Techniques NASA Code Q Software Program Center Initiative UPN 323-08; Kenneth McGill, Research Lead OSMA Software Assurance Symposium 2003 July 30 – Aug 1, 2003 The work described in this presentation was carried out at the Jet Propulsion Laboratory, California Institute of Technology. This work is sponsored by the National Aeronautics and Space Administration’s Office of Safety and Mission Assurance under the NASA Software Program led by the NASA Software IV&V Facility. This activity is managed locally at JPL through the Assurance Technology Program Office (ATPO).
Agenda • Overview • Goals • Benefits • Approach • Status • Current Results • Papers and Presentations Resulting From This CI
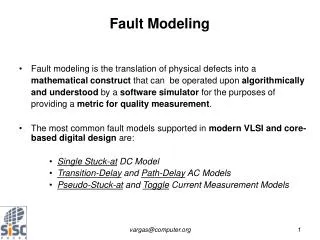
planning (e.g., time to allocate for testing, identify fault prone modules)guidance (e.g., choose design that will lead to fewer faults)assessment (e.g., know when close to being done testing Use measurements to PREDICT faults, and so achieve better 26 4 142 37 6 75 Structural Measurementsof Specification Structural Measurementsof Source Code Estimated Fault Counts by Type for Implemented System ... ... ... 1.5 1 2 1 2 1.5 3 41 258 5 3 1 Numbers of estimated faults of given type in given module 2 1 ... ComponentSpecifications ... Source Code Modules 2 Source Code Modules ... … 3 ... ... 3 1.9 1.25 ... 3.5 Measure-ments of given type for given module ... 3 5 Lines ofSourceCode MaxNestingDepth ConditionalExecutionFaults ExecutionOrderFaults Number ofExceptions FunctionCount 4 types of measurements types of faults types of measurements 3 TotalOperands EnvironmentalConstraints VariableUsageFaults IncorrectComputation Overview Objectives: Gain a better quantitative understanding of the effects of requirements changes on fault content of implemented system. Gain a better understanding of the type of faults that are inserted into a software system during its lifetime.
Goals • Develop a viable method of infusing the measurement and fault modeling techniques developed during the first two years of this task into software development environments at GSFC and JPL • Collaborate with SATC and selected projects at GSFC • Continue and extend collaboration with projects at JPL • Develop training materials for software measurement for software engineers/software assurance personnel • Measurement background • Using DARWIN Network Appliance • Organizational interfaces • Interpreting output
Benefits • Provide quantitative information as a basis for making decisions about software quality. • Use easily obtained metrics to identify software components that pose a risk to software and system quality. • Measurement framework can be used to continue learning as products and processes evolve.
Approach • Measure structural evolution on collaborating development efforts • Structural measurements for several JPL projects collected • Several GSFC projects have shown interest • Analyze failure data • Identify faults associated with reported failures • Relies on: • All failures being recorded • Failure reports specifying which versions of which files implement changes responding to the reported failure. • Count number of repaired faults according to token-count technique reported in ISSRE’02 [Mun02]. (Fault count is dependent variable) • Analyze relationships between number of faults repaired and measured structural evolution during development
Approach (cont’d) • Identify relationships between requirements change requests and implemented quality/reliability • Measure structural characteristics of requirements change requests (CRs). • Track CR through implementation and test • Analyze failure reports to identify faults inserted while implementing a CR • Develop training materials for software measurement for software engineers/software assurance personnel • DARWIN user’s guide nearly complete • Measurement class materials being prepared
Status • Follow-on to previous 2-year effort, “Estimating and Controlling Software Fault Content More Effectively”. • Investigated relationships between requirements risk and reliability. • Installed improved version of structural and fault measurement framework on JPL development efforts • Participating efforts • Mission Data System (MDS) • Mars Exploration Rover (MER) • Multimission Image Processing Laboratory (MIPL) • GSFC efforts • All aspects of measurement are now automated • Fault identification and measurement was previously a strictly manual activity • Measurement is implemented in DARWIN, a network appliance • Minimally intrusive • Consistent measurement policies across multiple projects
Current Results: Measuring Software Structural Evolution • Mars Exploration Rover (MER) • Multimission Image Processing Laboratory (MIPL) • Mission Data System (MDS) • Structural measurements collected for release 5 of MDS • > 1500 builds • > 65,000 unique modules • Domain scores, “domain churn”, and proportional fault burdens computed • At system level • At individual module level • > 1,400 anomaly reports analyzed
Current Results: Measuring Software Structural Evolution Build i Measurement Tools Baselined Build i Domain Churn Domain Score Change Baseline Source Code PCA Domain Scores Domain Deltas Build j Baselined Build j
DARWIN Portal – Main Page This is the main page of the DARWIN measurement system’s user interface.
DARWIN – Structural Evolution Plot Chart of a system’s structural evolution during development. This is available under “Manager Information”. Clicking on a data point will bring up a report detailing the amount of change that occurred in each module. This plot shows some of the individual builds for release 5 of the MDS.
DARWIN – Module-Level Build Details This report shows the amount of change that’s occurred for each module shown in this particular build (2002-02-07).
Current Results: Measuring Software Structural Evolution Standardized definitions were developed for each measurement
Current Results: Measuring Software Structural Evolution Table above shows measurement domains resulting from PCA
Current Results: Fault Identification and Measurement • Developing software fault models depends on definition of what constitutes a fault • Desired characteristics of measurements, measurement process • Repeatable, accurate count of faults • Measure at same level at which structural measurements are taken • Measure at module level (e.g., function, method) • Easily automated • More detail in [Mun02]
Current Results: Fault Identification and Measurement • Approach • Examine changes made in response to reported failures • Base recognition/enumeration of software faults on the grammar of the software system’s language • Fault measurement granularity in terms of tokens that have changed
Current Results: Fault Identification and Measurement • Approach (cont’d) • Consider each line of text in each version of the program as a bag of tokens • If a change spans multiple lines of code, all lines for the change are included in the same bag • Number of faults based on bag differences between • Version of program exhibiting failures • Version of program modified in response to failures • Use version control system to distinguish between • Changes due to repair and • Changes due to functionality enhancements and other non-repair changes
Current Results: Fault Identification and Measurement • Example 1 • Original statement: a = b + c; • B1 = {<a>, <=>, <b>, <+>, <c>} • Modified statement: a = b - c; • B2 = {<a>, <=>, <b>, <->, <c>} • B1 – B2 = {<+>, <-> } • |B1 | = |B2|, |B1 – B2| = 2 • One token has changed 1 fault
Current Results: Fault Identification and Measurement • Example 2 • Original statement: a = b - c; • B2 = {<a>, <=>, <b>, <->, <c>} • Modified statement: a = c - b; • B3 = {<a>, <=>, <c>, <->, <b>} • B2 – B3 = { } • |B2 | = |B3| , |B2 – B3| = 0 • 1 fault representing incorrect sequencing
Current Results: Fault Identification and Measurement • Example 3 • Original statement: a = b - c; • B3 = {<a>, <=>, <c>, <->, <b>} • Modified statement: a = 1 + c - b; • B4 = {<a>, <=>, <1>, <+>, <c>, <->, <b>} • B3 – B4 = {<1>, <+>} • |B3| = 6 , |B4| = 8 , |B4| – |B3| = 2 • 2 new tokens representing 2 faults
Current Results: Fault Identification and Measurement • Available Failure/Fault Information • For each failure observed during MDS testing, the following information is available • The names of the source file(s) involved in repairs • The version number(s) of the source files in repairs • Example on next slide
Current Results: Fault Identification and Measurement Available Failure/Fault Information – Example
Current Results: Fault Identification and Measurement Fault Identification and Counting Tool Output MDS_Fault_count/MDS_Rep.source.Mds.Fw.Car.c++.ArchetypeConnectorFactory.cpp 1 42 MDS_Fault_count/MDS_Rep.source.Mds.Fw.Car.c++.ArchitectureElementDefinition.cpp 1 35 MDS_Fault_count/MDS_Rep.source.Mds.Fw.Car.c++.ArchitectureInstanceRegistry.cpp 1 79 MDS_Fault_count/MDS_Rep.source.Mds.Fw.Car.c++.ArchitectureInstanceRegistry.cpp 2 8 MDS_Fault_count/MDS_Rep.source.Mds.Fw.Car.c++.ArchitectureInstanceRegistry.cpp 3 0 MDS_Fault_count/MDS_Rep.source.Mds.Fw.Car.c++.ArchManagedInstance.cpp 1 36 MDS_Fault_count/MDS_Rep.source.Mds.Fw.Car.c++.CallableInterface.cpp 1 48 MDS_Fault_count/MDS_Rep.source.Mds.Fw.Car.c++.CallableInterface.cpp 2 3 MDS_Fault_count/MDS_Rep.source.Mds.Fw.Car.c++.CGIMethodRegistration.cpp 1 4 MDS_Fault_count/MDS_Rep.source.Mds.Fw.Car.c++.Collection.cpp 1 12 MDS_Fault_count/MDS_Rep.source.Mds.Fw.Car.c++.Collection.cpp 2 37 MDS_Fault_count/MDS_Rep.source.Mds.Fw.Car.c++.ComponentComponentLinkInstance.cpp 1 0 MDS_Fault_count/MDS_Rep.source.Mds.Fw.Car.c++.ComponentComponentLinkInstance.cpp 2 65 MDS_Fault_count/MDS_Rep.source.Mds.Fw.Car.c++.ComponentConnectorLinkInstance.cpp 1 0 MDS_Fault_count/MDS_Rep.source.Mds.Fw.Car.c++.ComponentConnectorLinkInstance.cpp 2 50 MDS_Fault_count/MDS_Rep.source.Mds.Fw.Car.c++.ComponentObjectLinkInstance.cpp 1 27 MDS_Fault_count/MDS_Rep.source.Mds.Fw.Car.c++.ComponentObjectLinkInstanceArguments.cpp 1 0 MDS_Fault_count/MDS_Rep.source.Mds.Fw.Car.c++.ComponentRegistration.cpp 1 2 MDS_Fault_count/MDS_Rep.source.Mds.Fw.Car.c++.ConcreteComponentInstance.cpp 1 8 MDS_Fault_count/MDS_Rep.source.Mds.Fw.Car.c++.ConcreteComponentInstance.cpp 2 0 MDS_Fault_count/MDS_Rep.source.Mds.Fw.Car.c++.ConcreteConnectorInstance.cpp 1 42 MDS_Fault_count/MDS_Rep.source.Mds.Fw.Car.c++.ConcreteConnectorInstance.cpp 2 27 Output format: <Source file name> <source file version> <fault count>
Current Results: Modeling Fault Content • Fault models developed from: • Measured structural evolution (cumulative amount of change for each module). • Number of faults repaired for each module. • Analysis indicates that the amount of structural evolution is related to the number of faults repaired [Nik03].
Current Results: Modeling Fault Content • Regression ANOVA • Regression Model • Quality of the Regression Model
Current Results: Modeling Fault ContentFault Counting Method vs. Model Quality • Which fault counting methods produce better fault models? • Number of tokens changed • Number of “sed” commands required to make each change • Number of modules changed
Current Results: Modeling Fault ContentFault Counting Method vs. Model Quality • Number of tokens changed • Number of “sed” commands • Number of modules changed
Current Results: Modeling Fault ContentFault Counting Method vs. Model Quality Comparison of Model Quality