Download
1 / 1
10 likes | 87 Views
0.3. 0.3. A. B. -0.2. -0.2. 1.4. 1.6. 1.4. 1.2. Log 10 ( B i ) estimated from tissue-specific TFs. Log 10 ( B i ) estimated from widely expressed TFs. -0.7. -0.7. 1.2. 1. 1. 0.8. -1.2. -1.2. 0.8. 0.6. r = 0.729, t = 145.1, p<0.001. r = 0.768, t = 163.2, p<0.001. 0.6.

E N D
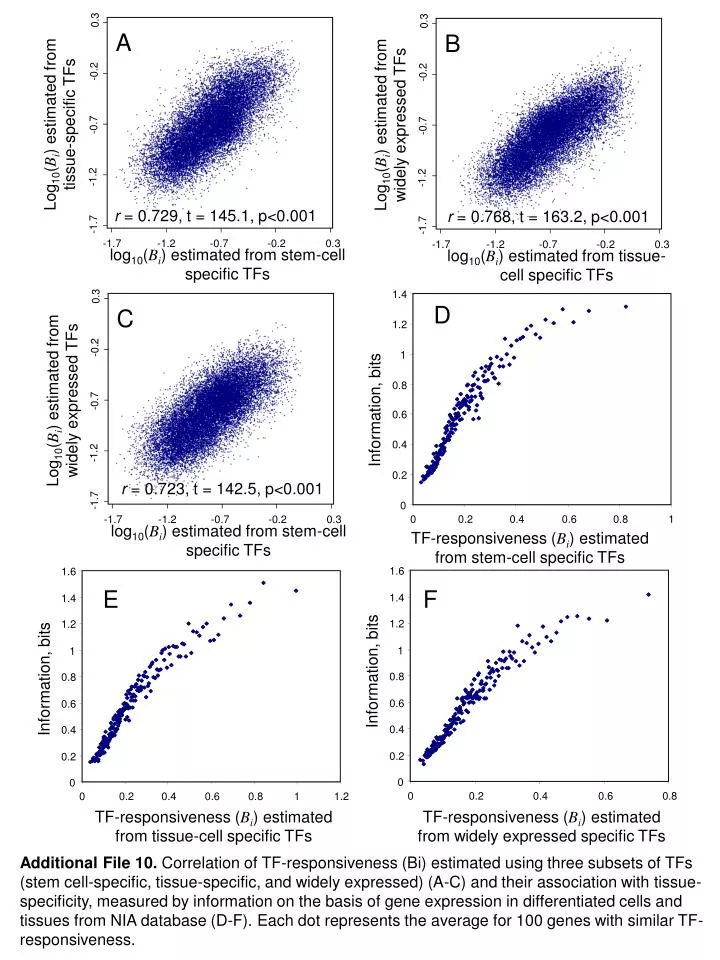
0.3 0.3 A B -0.2 -0.2 1.4 1.6 1.4 1.2 Log10(Bi) estimated from tissue-specific TFs Log10(Bi) estimated from widely expressed TFs -0.7 -0.7 1.2 1 1 0.8 -1.2 -1.2 0.8 0.6 r = 0.729, t = 145.1, p<0.001 r = 0.768, t = 163.2, p<0.001 0.6 -1.7 -1.7 0.4 -1.7 -1.2 -0.7 -0.2 0.3 -1.7 -1.2 -0.7 -0.2 0.3 0.4 log10(Bi) estimated from stem-cell specific TFs log10(Bi) estimated from tissue-cell specific TFs 0.2 0.2 0.3 D 0 0 C 0 0.2 0.4 0.6 0.8 1 0 0.2 0.4 0.6 0.8 1 1.2 -0.2 Log10(Bi) estimated from widely expressed TFs -0.7 Information, bits 1.6 -1.2 1.4 r = 0.723, t = 142.5, p<0.001 1.2 -1.7 -1.7 -1.2 -0.7 -0.2 0.3 1 log10(Bi) estimated from stem-cell specific TFs TF-responsiveness (Bi) estimated from stem-cell specific TFs 0.8 0.6 E F 0.4 0.2 Information, bits 0 Information, bits 0 0.2 0.4 0.6 0.8 TF-responsiveness (Bi) estimated from tissue-cell specific TFs TF-responsiveness (Bi) estimated from widely expressed specific TFs Additional File 10.Correlation of TF-responsiveness (Bi) estimated using three subsets of TFs (stem cell-specific, tissue-specific, and widely expressed) (A-C) and their association with tissue-specificity, measured by information on the basis of gene expression in differentiated cells and tissues from NIA database (D-F). Each dot represents the average for 100 genes with similar TF-responsiveness.