Download
1 / 22
220 likes | 388 Views
Using Achievement Data to inform Teaching and Learning with Pasifika students. PPTA Pasifika Teachers' Conference July 2006. Annie Sio-Tema & Siliva Gaugatao. AIMs for today:. 1. To gain a ‘quick’ overview of asTTle. 2. To explore the use of achievement data to inform

E N D
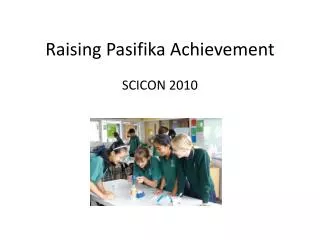
Using Achievement Data to inform Teaching and Learning with Pasifika students PPTA Pasifika Teachers' Conference July 2006 Annie Sio-Tema & Siliva Gaugatao
AIMs for today: 1. To gain a ‘quick’ overview of asTTle 2. To explore the use of achievement data to inform Teaching and Learning with Pasifika students PPTA Pasifika Teachers' Conference July 2006 3. To discuss four key principles for effective teaching and learning of literacy and language
Assessment Tools for Teaching and Learning PPTA Pasifika Teachers' Conference July 2006
The purpose of the To provide analysed assessment information that can be used to improve teaching and learning. To provide externally referenced assessment information that will assist teachers to make valid, reliable, and nationally consistent judgements about the work and progress of their students PPTA Pasifika Teachers' Conference July 2006
The purpose of the asTTle tool for schools At classroom level asTTle will enable teachers to: • diagnose how their students are performing; • give their students focussed feedback; • enable teachers to help students set learning goals; • develop and modify their classroom programmes. PPTA Pasifika Teachers' Conference July 2006 At school level information may be aggregated and used to evaluate teaching programmes and inform strategic planning.
The Console Report The console gives you information relating to the achievement of all, or particular groups of your students, compared to nationally-referenced performance.
The New Zealand comparisons you have chosen General test information For a multi-level class you can select one, two, or three year levels. The Console Report in sections – the top The default selection is for the year group with the most students in it and ‘all’ for every other category.
This shows the attitude your selected students have to the content tested on a scale shown by the smiley (or not) faces. The national mean for all students is shown by the green bar. Your selected students’ mean – remember some students will be outside the red circle. Remember that although attitude does not predict achievement it is still an important facet of children’s learning. The Console Report in sections – the bottom
The Console Report in sections – the asTTle scales If you have chosen more than one year level in your class you will get a scale for each one. This compares the distribution of scores for your class with the national distribution for reading, writing, or maths, based on the interaction effects you have chosen. Highest score 75th percentile 25th percentile Lowest score The national distribution is shown in blue The median for your class is shown by the red line.
The Console Report in sections – Depth of Thinking This shows the level of cognitive processing by your students in the test. Both their surface thinking and their deep thinking is compared against the national mean for the comparison groups you chose. Surface thinking is their ability to use one or unconnected lists of facts, information, or ideas to answer questions. Deep thinking is their ability to relate the facts, ideas, or information to each other and to hypothesise about them in a more abstract manner.
Information relating to the content areas you have focused your test on. Your class mean is compared to the national mean for the groups you have selected. (For writing this would show all seven marking elements) Note: Differences of more than 15 points (the standard error of measurement) are significant for teaching and learning. Your class mean is shown by the red arrow on the dial The national mean for selected groups is shown by the blue shaded area The Console Report in sections – the sides
This is the ‘skyline’ – showing you graphically the spread of your class over the curriculum levels. For reading– the curriculum functions you have tested are shown along with three curriculum processes. For writing–the ‘skyline’shows the seven elements the writing is marked on. Curriculum Levels Report Within each curriculum level there are three categories of ability to provide you with more precise information – basic (B), proficient (P), and advanced (A).
Clicking on a graph will take you directly to a table showing which students are at each level. This report allows you to (a) group students appropriately and (b) monitor that students are moving up levels throughout the year. Curriculum Levels Report
Individual Learning Pathways - Reading contd. Strengths Hard questions that the student got right To be achieved Hard questions that the student got wrong Gaps Easy questions the student got wrong Achieved Easy questions that the student got right Where the questions are placed is determined by the ability of your student, as shown by their total mean score on the ALS, and the difficulty of the questions and whether they should have got them right or not given their ALS score – think back to the continuum ALS
These reports are for individual students so that you can plan for their specific needs. Each item in the test is placed in one of four quadrants. The asTTle Reading scale (aRs) – this is your student’s overall mean score (shown by the red oval) compared to the national mean score (shown by the coloured bar). Console information for individual students gives scores and levels for: the content areas tested overall, surface and deep thinking, and the national mean for their year group. Individual Learning Pathways Report – reading/mathematics
aRs Individual Learning Pathways Report – reading/mathematics, contd. ‘Hard’ questions the student got right ‘Hard’ questions the student got wrong ‘Easy’ questions the student got wrong ‘Easy’ questions the student got right The placement of the items in the four quadrants relates to the student’s level. ‘Hard’ items are those that would be difficult for this student, and ‘easy’ items are those that we would expect the student to get right – they are easy for this student.
Strengths Take advantage by giving the student similar work at this level To be achieved Plan to teach these objectives at this level within the next term Achieved Stop teaching this type of material at this level to this student Gaps Investigate causes but don’t ‘skill & drill’ teach these objectives – they are easy and the student will learn them quickly Individual Learning Pathways Report– implications for teaching
Group Learning Pathways Report • In this report, the bar indicates the proportion of students in the group for whom the achievement objective was: • a gap • to be achieved • achieved • a strength. Gaps are shown as pink To be achieved as yellow Achieved as green Strengths as blue A predominance of red and yellow is an indicator that the class as a whole needs to be taught that achievement objective The green and blue indicates achievement objectives that the class has largely achieved and does not need to be re-taught
Your class average level A hyper link to a resource bank which contains appropriate teacher and student material for each of the levels used in asTTle (you need to be logged on to the Internet). This enables you to identify and plan for students’ next steps in learning. What Next Report This shows you the mean level at which your class is achieving for the curriculum functions that were tested.
Where to from here with asTTle? • Find out what is happening with asTTle in your school • Give it a go • For schools having difficulties to talk through the issues PPTA Pasifika Teachers' Conference July 2006 Please contact us for more information. Annie Sio-Tema: a.sio-tema@auckland.ac.nz Siliva Gaugatao: s.gaugatao@auckland.ac.nz
UsingAchievement Data to inform Teaching and Learning with Pasifika students Some strategies to explore! PPTA Pasifika Teachers' Conference July 2006
UsingAchievement Data to inform Teaching and Learning with Pasifika students PPTA Pasifika Teachers' Conference July 2006 Annie Sio-Tema & Siliva Gaugatao