Download
1 / 25
250 likes | 255 Views
This practice exercise includes solving quadratic equations by graphing, estimating roots, using the quadratic equation, and applying translations, dilations, and reflections to quadratic functions.

E N D
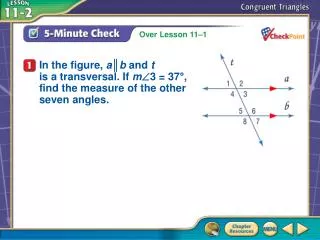
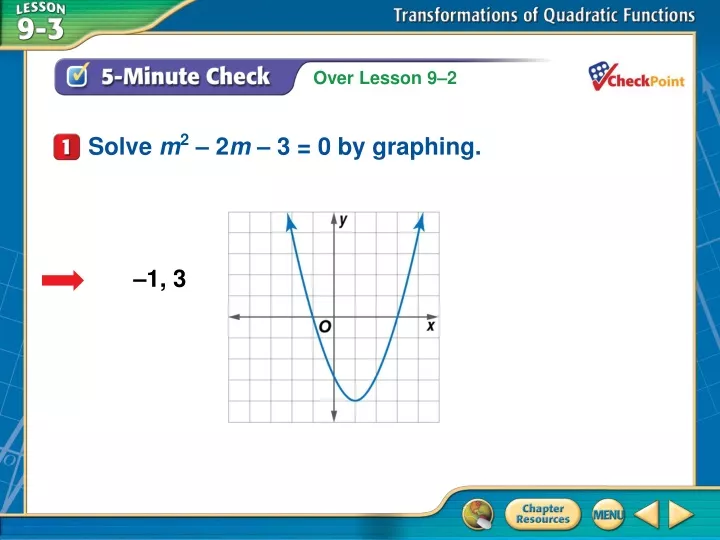
A B C D Solve m2 – 2m – 3 = 0 by graphing. –1, 3 5-Minute Check 1
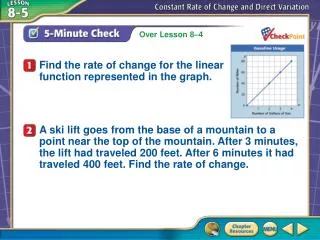
A B C D Solve w2 + 5w – 1 = 0 by graphing. If integral roots cannot be found, estimate the roots to the nearest tenth by using the trace function. –2.6, -7.2 5-Minute Check 2
A B C D Use the quadratic equation to find two numbers that have a difference of 3 and a product of 10. 5, 2 5-Minute Check 3
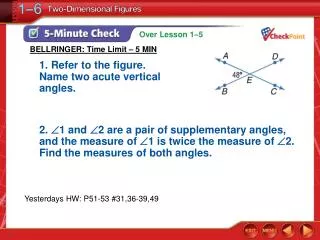
A B C D Solve 21 = x2 + 2x – 14 by graphing. –7, 5 5-Minute Check 4
Apply translations of quadratic functions. • Apply dilations and reflections to quadratic functions.
transformation--A mapping or movement of a geometric figure that changes its shape or position. • translation--A transformation in which a figure is slid in any direction. • dilation--A transformation in which a figure is enlarged or reduced • reflection--A transformation in which a figure is flipped over a line of symmetry. Vocabulary
Describe and Graph Translations A. Describe how the graph of h(x) = 10 + x2 is related to the graph f(x) = x2. Answer: The value of c is 10, and 10 > 0. Therefore, the graph of y = 10 + x2 is a translation of the graph y = x2 up 10 units. Example 1
Describe and Graph Translations B. Describe how the graph of g(x) = x2 – 8 is related to the graph f(x) = x2. Answer: The value of c is –8, and –8 < 0. Therefore, the graph of y = x2 – 8 is a translation of the graph y = x2 down 8 units. Example 1
A B C D A. Describe how the graph of h(x) = x2 + 7 is related to the graph of f(x) = x2. A.h(x) is translated 7 units up from f(x). B.h(x) is translated 7 units down from f(x). C.h(x) is translated 7 units left from f(x). D.h(x) is translated 7 units right from f(x). Example 1
A B C D B. Describe how the graph of g(x) = x2 – 3 is related to the graph of f(x) = x2. A.g(x) is translated 3 units up from f(x). B.g(x) is translated 3 units down from f(x). C.g(x) is translated 3 units left from f(x). D.g(x) is translated 3 units right from f(x). Example 1
The function can be written d(x) = ax2, where a = . 1 __ 3 Describe and Graph Dilations Example 2
1 1 __ __ 3 3 Answer: Since 0 < < 1, the graph of y = x2 is a vertical compression of the graph y = x2. Describe and Graph Dilations Example 2
Describe and Graph Dilations B. Describe how the graph of m(x) = 2x2 + 1 is related to the graph f(x) = x2. The function can be written m(x) = ax2 + c, where a = 2 and c = 1. Example 2
Describe and Graph Dilations Answer: Since 1 > 0 and 3 > 1, the graph of y = 2x2 + 1 is stretched vertically and then translated up 1 unit. Example 2
A B C D A. Describe how the graph of n(x) = 2x2 is related to the graph of f(x) = x2. A.n(x) is compressed vertically from f(x). B.n(x) is compressed horizontally from f(x). C.n(x) is stretched vertically from f(x). D.n(x) is stretched horizontally from f(x). Example 2
A B C D B. Describe how the graph of b(x) = x2 – 4 is related to the graph of f(x) = x2. 1 __ 2 A.b(x) is stretched vertically and translated 4 units down from f(x). B.b(x) is compressed vertically and translated 4 units down from f(x). C.b(x) is stretched horizontally and translated 4 units up from f(x). D.b(x) is stretched horizontally and translated 4 units down from f(x). Example 2
Describe and Graph Reflections Describe how the graph of g(x) = –3x2 + 1 is related to the graph of f(x) = x2. You might be inclined to say that a = 3, but actually three separate transformations are occurring. The negative sign causes a reflection across the x-axis. Then a dilation occurs in which a = 3 and a translation occurs in which c = 1. Example 3
Describe and Graph Reflections Answer: The graph of g(x) = –3x2 + 1 is reflected across the x-axis, stretched by a factor of 3, and translated up 1 unit. Example 3
A B C D Describe how the graph of g(x) = –5x2 – 4 is related to the graph of f(x) = x2. A. The graph of g(x) is reflected across the x-axis, compressed, and translated up 4 units. B. The graph of g(x) is reflected across the x-axis, compressed, and translated up 5 units. C. The graph of g(x) is reflected across the x-axis, compressed, and translated down 4 units. D. The graph of g(x) is reflected across the y-axis, and translated down 4 units. Example 3
Which is an equation for the function shown in the graph? A y = x2 – 2 B y = 3x2 + 2 C y = – x2 + 2 D y = –3x2 – 2 1 1 __ __ 3 3 Example 4
Read the Test Item You are given the graph of a parabola. You need to find an equation of the graph. Solve the Test Item Notice that the graph opens upward. Therefore, equations C and D are eliminated because the leading coefficient should be positive. The parabola is translated down 2 units, so c = –2 which is shown in equation A. Answer: The answer is A. Example 4
A B C D Which is an equation for the function shown in the graph? A.y = –2x2 – 3 B.y = 2x2 + 3 C.y = –2x2 + 3 D.y = 2x2 – 3 Example 4