Download
1 / 4
40 likes | 45 Views
This analysis compares the fixed and variable costs of two alternative logistics systems for C&B Chemical Company. The graph illustrates the trade-off points where the total costs of the systems are equal. Examining the data in Figure 2-11, we can determine the optimal logistics system for the company.

E N D
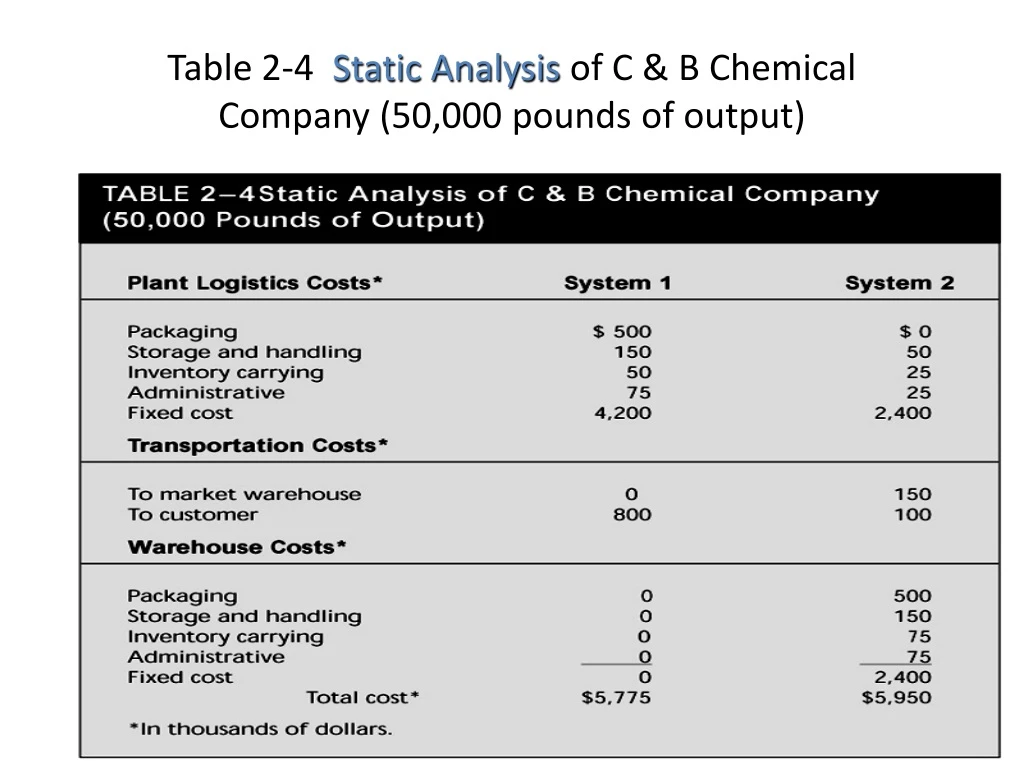
Table 2-4 Static Analysis of C & B Chemical Company (50,000 pounds of output)
Techniques of Logistics System Analysis: Long-Run/Dynamic Analysis • This technique is illustrated in Figure 2-11. • Comprised a graph of the fixed and variable costs of at least two alternative logistics systems. • The graph may have at least one indifference point, but may have multiple points of indifference. • Examine the data presented in Figure 2-11.
System 1 Total Cost = Fixed Costs + Variable Cost/unit x number of units y = $4200 + 0.0315x System 2 Total Cost = Fixed Costs + Variable Cost/unit x number of units y = $4800 + 0.0230x Trade-off Point System 1 Total Costs = System 2 Total Costs $4200 + 0.0315x = $4800 + 0.0230x 0.0085x = $600 x= 70,588 pounds Dynamic Analysis