Download
1 / 71
710 likes | 876 Views
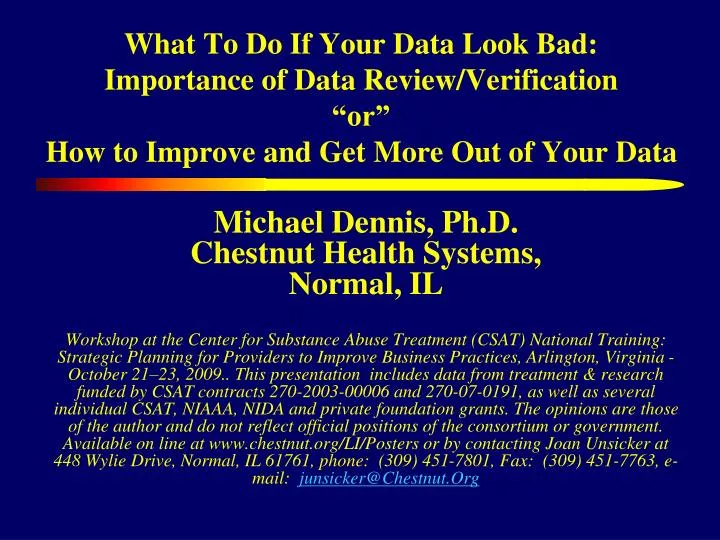
What To Do If Your Data Look Bad: Importance of Data Review/Verification “or” How to Improve and Get More Out of Your Data. Michael Dennis, Ph.D. Chestnut Health Systems, Normal, IL

E N D
What To Do If Your Data Look Bad: Importance of Data Review/Verification“or”How to Improve and Get More Out of Your Data Michael Dennis, Ph.D. Chestnut Health Systems, Normal, IL Workshop at the Center for Substance Abuse Treatment (CSAT) National Training: Strategic Planning for Providers to Improve Business Practices, Arlington, Virginia - October 21–23, 2009.. This presentation includes data from treatment & research funded by CSAT contracts 270-2003-00006 and 270-07-0191, as well as several individual CSAT, NIAAA, NIDA and private foundation grants. The opinions are those of the author and do not reflect official positions of the consortium or government. Available on line at www.chestnut.org/LI/Posters or by contacting Joan Unsicker at 448 Wylie Drive, Normal, IL 61761, phone: (309) 451-7801, Fax: (309) 451-7763, e-mail: junsicker@Chestnut.Org
Provide an overview of what it means to move the field towards both evidence based practice and practice based evidence Discuss strategies that help to make measures more reliable, valid, efficient and useful Providing examples of how to use data to guide program planning and evaluation Goals of this Presentation are to
Introductory Exercise • Find your partners form a small group & discuss the following: • Your history and experience in field? • Areas that your are passionate about • Innovations that excite you • What are your greatest Challenges in the field? • What are you least enthused about? • Discussion—history of substance abuse or addiction services to clients and current changes in the landscape of the system.
Part 1. Provide an overview of what it means to move the field towards both evidence based practice and practice based evidence
The field is increasingly facing demands from payers, policymakers, and the public at large for “evidence-based practices (EBP)” which can reliably produce practical and cost-effective interventions, therapies and medications that will reduce risks for initiating drug use among those not yet using, reduce substance use and its negative consequences among those who are abusing or dependent, and reduce the likelihood of relapse for those who are recovering NIDA Blue Ribbon Panel on Health Services Research (see http://www.nida.nih.gov ) Context
So what does it mean to move the field towards Evidence Based Practice (EBP)? Introducing explicit intervention protocols that are Targeted at specific problems/subgroups and outcomes Having explicit quality assurance procedures to cause adherence at the individual level and implementation at the program level Having the ability to evaluate performance and outcomes For the same program over time, Relative to other interventions Introducing reliable and valid assessment that can be used At the individual level to immediately guide clinical judgments about diagnosis/severity, placement, treatment planning, and the response to treatment At the program level to drive program evaluation, needs assessment, performance monitoring and long term program planning
Interventions that Typically do Better than Usual Practice in Reducing Recidivism (29% vs. 40%) in meta analysis of 509 Juvenile Justice Studies Adolescent Community Reinforcement Approach (ACRA) Aggression Replacement Training Assertive Continuing Care Brief Strategic Family Therapy (BSFT) Interpersonal Social Problem Solving Functional Family Therapy (FFT) MET/CBT combinations and Other manualized CBT Moral Reconation Therapy Multidimensional Family Therapy (MDFT) Multisystemic Therapy (MST) Reasoning & Rehabilitation Thinking for a Change NOTE: There is generally little or no differences in mean effect size between these brand names Source: Adapted from Lipsey et al 2001, Waldron et al, 2001, Dennis et al, 2004
Major Predictors of Bigger Effects Chose a strong intervention protocol based on prior evidence Used quality assurance to ensure protocol adherence and project implementation Used proactive case supervision of individual Used triage to focus on the highest severity subgroup
Impact of the numbers of Favorable features on Recidivism (509 JJ studies) Source: Adapted from Lipsey, 1997, 2005
Implementation is Essential (Reduction in Recidivism from .50 Control Group Rate) Source: Adapted from Lipsey, 1997, 2005
Also Need Protocols Targeted at : Detoxification services and medication, particularly related to opioid and methamphetamine use Tobacco cessation Adolescent psychiatric services related to depression, anxiety, ADHD, and conduct disorder Trauma, suicide ideation, & parasuicidal behavior Need for child maltreatment interventions (not just reporting protocols) HIV Intervention to reduce high risk pattern of sexual behavior Anger Management Problems with family, school, work, and probation Recovery coaches, recovery schools, recovery housing and other adolescent oriented self help groups / services
On-site proactive urine testing can be used to reduce false negatives by more than half
Evaluation of an OTI Waiting List Reduction Grant from Appointment and Admission Log Source: Dennis, Ingram, Burks & Rachal, 1994
Evaluation of an OTI Waiting List Reduction Grant from Appointment and Admission Log Source: Dennis, Ingram, Burks & Rachal, 1994
The Monthly Census Further Demonstrates the Grant’s Impact on Program Capacity Source: Dennis, Ingram, Burks & Rachal, 1994
Example of a Simple Theory / Logic Model for Early Re-Intervention (ERI) Experiment Source: Scott & Dennis (2009)
Improving Adherence to Recovery Management Checkup (RMC) Source: Scott & Dennis (2009)
Improving Adherence to Recovery Management Checkup (RMC) Source: Scott & Dennis (2009)
Adolescent Rates of High (2+) Scores on Mental Health (MH) or Substance Abuse (SA) Screener by Setting in Washington State Source: Lucenko et al (2009). Report to the Legislature: Co-Occurring Disorders Among DSHS Clients. Olympia, WA: Department of Social and Health Services. Retrieved from http://publications.rda.dshs.wa.gov/1392/
Adult Rates of High (2+) Scores on Mental Health (MH) or Substance Abuse (SA) Screener by Setting in Washington State Source: Lucenko et al (2009). Report to the Legislature: Co-Occurring Disorders Among DSHS Clients. Olympia, WA: Department of Social and Health Services. Retrieved from http://publications.rda.dshs.wa.gov/1392/
Adolescent Client Validation of Hi Co-occurring from GAIN Short Screener vs Clinical Records by Setting in Washington State Source: Lucenko et al (2009). Report to the Legislature: Co-Occurring Disorders Among DSHS Clients. Olympia, WA: Department of Social and Health Services. Retrieved from http://publications.rda.dshs.wa.gov/1392/
Adult Client Validation of Hi Co-occurring from GAIN Short Screener vs Clinical Records by Setting in Washington State Source: Lucenko et al (2009). Report to the Legislature: Co-Occurring Disorders Among DSHS Clients. Olympia, WA: Department of Social and Health Services. Retrieved from http://publications.rda.dshs.wa.gov/1392/
The Time, Cost and Return on Assessment Typically go up with Comprehensiveness
Number of Major Clinical Problems Identified by Type (and length) of Assessment Source: Reclaiming Futures Portland, OR and Santa Cruz, CA sites (n=192)
Reclaiming Futures ASAM Placement Cells Source: Reclaiming Futures Portland, OR and Santa Cruz, CA sites (n=192)
Other Common Treatment Planning Needs: Reclaiming Futures Source: Reclaiming Futures (n=192)
Information Infrastructure also vary in the Need for Additional Enterprise Expertise Source: Rohm, H. & Halbach, L. (2005). A Balancing Act: Sustaining New Directions. Perform,3 (2), 1-8
Systems Need a Progressive Continuum of Measurement (Common Measures) Screening to Identify Who Needs to be “Assessed” (5-10 min) Focus on brevity, simplicity for administration & scoring Needs to be adequate for triage and referral GAIN Short Screener for SUD, MH & Crime ASSIST, AUDIT, CAGE, CRAFT, DAST, MAST for SUD BSI, CANS, HSCL, K10, MAYSI, SCL, for Mental Health LSI, MAYSI, YLS for Crime Quick Assessment for Targeted Referral (20-30 min) Assessment of who needs a feedback, brief intervention or referral for more specialized assessment or treatment Needs to be adequate for brief intervention GAIN Quick ADI, ASI, MINI, PDSQ, SASSI, T-ASI, Comprehensive Biopsychosocial (1-2 hours) Used to identify common problems and how they are interrelated Needs to be adequate for diagnosis, treatment planning and placement of common problems GAIN Initial (Clinical Core and Full) CASI, A-CASI, MATE Specialized Assessment (additional time per area) Additional assessment by a specialist (e.g., psychiatrist, MD, nurse, spec ed) may be needed to rule out a diagnosis or develop a treatment plan or individual education plan CIDI, DIS, DISC, KSADS, PDI, SCAN, SCID
Major changes consistently take 2-3 years to complete Manuals and workshops alone have little impact on practice It is the addition of practice, feedback and monitoring that have reliably produced change in practice Implementation is governed by three factors: cost, quality, and speed You can optimize up to two of the above, but the third will always give as a result Source: Fixsen et al 2005 Key Lessons from Implementation Science From Over Two Dozen Fields
Part 2. Discuss strategies that help to make measures more reliable, valid, efficient and useful
Key Measurement Issues in our Field High turnover workforce with variable educationbackground related to diagnosis, placement, treatment planning and referral to other services Heterogeneous needs and severitycharacterized by multiple problems, chronic relapse, and multiple episodes of care over several years Lack of access to or use of data at the program levelto guide immediate clinical decisions, billing and program planning Missing, bad or misrepresented datathat needs to be minimized and incorporated into interpretations Lack of Infrastructure that is needed to support implementation and fidelity
1. High Turnover Workforce with Variable Education Questions spelled out and simple question format Lay wording mapped onto expert standards for given area Built in definitions, transition statements, prompts, and checks for inconsistent and missing information. Standardized approach to asking questions across domains Range checks and skip logic built into electronic applications Outcome: Improved Reliability and Efficiency • Formal training and certification protocols on administration, clinical interpretation, data management, coordination, local, regional, and national “trainers” • Above focuses on consistency across populations, level of care, staff and time • On-going quality assurance and data monitoring for the reoccurrence or problems at the staff (site or item) level • Availability of training resources, responses to frequently asked questions, and technical assistance
2. Heterogeneous Needs and Severity Outcome: Comprehensive Assessment • Multiple domains • Focus on most common problems • Participant self description of characteristics, problems, needs, personal strengths and resources • Behavior problem recency, breadth , and frequency • Utilization lifetime, recency and frequency • Dimensional measures to measure change with interpretative cut points to facilitate decisions • Items and cut points mapped onto DSM for diagnosis, ASAM for placement, and to multiple standards and evidence- based practices for treatment planning • Computer generated scoring and reports to guide decisions • Treatment planning recommendations and links to evidence-based practice • Basic and advanced clinical interpretation training and certification
3. Lack of Access to or use of Data at the Program Level Outcome: Improved Program Planning and Outcomes • Data immediately available to support clinical decision making for a case • Data can be transferred to other clinical information system to support billing, progress reports, treatment planning and on-going monitoring • Data can be exported and cleaned to support further analyses • Data can be pooled with other sites to facilitate comparison and evaluation • PC and web based software applications and support • Formal training and certification on using data at the individual level and data management at the program level • Data routinely pooled to support comparisons across programs and secondary analysis • Scientists already working with data to link to evidence-based practice
4. Missing, Bad or Misrepresented Data Outcome: Improved Validity • Assurances, time anchoring, definitions, transition, and question order to reduce confusion and increase valid responses • Cognitive impairment check • Validity checks on missing, bad, inconsistency and unlikely responses • Validity checks for atypical and overly random symptom presentations • Validity ratings by staff • Training on optimizing clinical rapport • Training on time anchoring • Training answering questions, resolving vague or inconsistent responses, following assessment protocol and accurate documentation. • Utilization and documentation of other sources of information • Post hoc checks for on-going site, staff or item problems
5. Lack of Infrastructure Outcome: Implementation with Fidelity Direct Services • Training and quality assurance on administration, clinical interpretation, data management, follow-up and project coordination • Data management • Evaluation and data available for secondary analysis • Software support • Technical assistance and back up to local trainer/expert Development • Clinical Product Development • Software Development • Collaboration with IT vendors (e.g., WITS) • Number of internal & external scientists and students • Workgroups focused on specific subgroup, problem, or treatment approach • Labor supply (e.g., consultant pool, college courses)
Other Things that Make a Difference Identify assessments that can be eliminated or reduced Identify paperwork that can be eliminated or automated from assessment Identify regulations that may need exceptions or to be modified Set up staff recognition and/or second salary tier to recognize proficiency Provide staff with feedback on what you have learned and demonstrating you are using the data Have brain storming sessions to “interpret” the data
Example of a Brain Storming Exercise Have staff identify major issues that are coming up that they would like to see more help with Group and prioritize those that are clinical important but for which they have the list guidance or support Walk through such cases to identify what has been done in the past, what worked and what did not Identify other possible approaches EXAMPLE
Part 3. Using Data to Guide Program Planning, and Evaluation
Common Local Evaluation Questions Who is being served? who are we missing? How are we welcoming, accommodating and/or building on their strengths? What services are being provided? to what extent are services being targeted toward the most needy or appropriate? to what extent are the services being implemented / delivered? Which of several different approaches to providing services are working the best? for which subgroups, for which outcomes? Are there a range of approaches that work similarly? What do the approaches costs? Is a given service more cost-effective in terms of the core outcome? Is a given service more cost-beneficial across multiple outcomes?
GAIN SS Total Score is Correlated With Level Of Care Placement: Adolescents
GAIN SS Total Score is Correlated With Level Of Care Placement: Adults
Trigger to refer for further assessment Denominator for evaluating staff and program performance Simple summary for judges, managed care, family and other gate keepers Allow staff to use in their private practice as a perk Use for third party referrals (e.g., my friend’s nephew) Other Key Uses
Moreover the Type of Co-occurring Mental Health Problems Vary with Age Source: Chan, YF; Dennis, M L.; Funk, RR. (2008). Prevalence and comorbidity of major internalizing and externalizing problems among adolescents and adults presenting to substance abuse treatment. Journal of Substance Abuse Treatment, 34(1) 14-24 .
Exploring Need, Unmet Need, & Targeting of Mental Health Services in AAFT
Mental Health Problem (at intake) vs. Any MH Treatment by 3 months Source: 2008 CSAT AAFT Summary Analytic Dataset