Download
1 / 11
110 likes | 331 Views
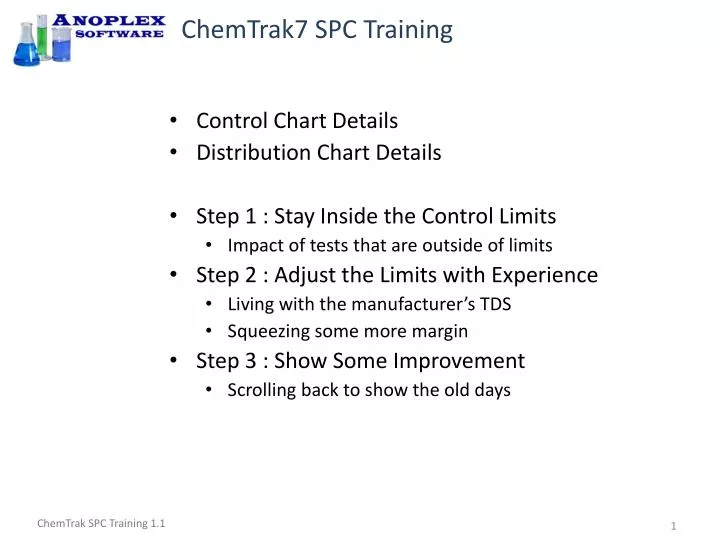
ChemTrak7 SPC Training. Control Chart Details Distribution Chart Details Step 1 : Stay Inside the Control Limits Impact of tests that are outside of limits Step 2 : Adjust the Limits with Experience Living with the manufacturer’s TDS Squeezing some more margin

E N D
ChemTrak7 SPC Training • Control Chart Details • Distribution Chart Details • Step 1 : Stay Inside the Control Limits • Impact of tests that are outside of limits • Step 2 : Adjust the Limits with Experience • Living with the manufacturer’s TDS • Squeezing some more margin • Step 3 : Show Some Improvement • Scrolling back to show the old days
Control Chart Details Test below LCL and post-add value at UCL. Vertical bars show range of daily test results. USL (Upper Specification Limit) (0.85)from manufacturer’s TDS One test on this day. Range of test results this day. UCL (0.81) and LCL (0.75) must be set by you to keep test results far away from USL and LSL so Cpk > 1.33. Starting date for Control and Distribution Charts. Ending date for Control and Distribution Charts. LSL (Lower Specification Limit) (0.65)from manufacturer’s TDS Each vertical line is 1 day. Chart covers ~ 4 months. Use the scroll bar on the Test Log to move dates.
Distribution Chart Details USL, UCL, LCL and LSL on vertical axis Maximum value on the horizontal axis is set by the maximum count (131 in this example). Other bar lengths are relative to the maximum. 5 readings just above the UCL 131 readings just below the UCL 27 readings below the LCL µ (average value of all readings) is 0.788 Cpk = 0.82 for the time period from 11/14/11 to 3/5/12 Cpk should be at least 1.33 If 3σ tail is too near the USL, “Check UCL” will show. 263 samples during time period from 11/14/11 to 3/5/12 If 3σ tail is too near the LSL, “Check LCL” will show.
Step 1 : Stay Inside the Control Limits Too many results below the LCL This is the worst result in the past 4-month period. Note: Cpk = 0.82
Step 1 : Stay Inside the Control Limits Too many results below the LCL Without this one test result ... … Cpkimproved to 0.84
Step 1 : Stay Inside the Control Limits Now there are no results below LCL With all of the low test results removed … … Cpkimproved to 0.91 … 0.91 < 1.33 so process still not under control.
Step 2 : Adjust the Limits with Experience • Current experience shows σ = 0.025 and µ = 0.788 oz/gal • TDS Sets USL at 0.85 oz/gal and 0.8 oz/gal is optimum. • For Cpk = 1.33, if µ = 0.80 then σ = (0.85 – 0.80) / 4 = 0.0125 • For Cpk = 1.33, if µ = 0.79 then σ = (0.85 – 0.79) / 4 = 0.015 • So, we must decrease the UCL, but not below 0.8 oz/gal, and we must increase the LCL to reduce σ from 0.025 to ~0.015.
Step 2 : Adjust the Limits with Experience Lower the UCL to 0.8 and raise the LCL to 0.76 oz/gal. After 4 months, the Cpk is improved from 0.82 to 1.38 -even with 7 readings < LCL. This is a huge improvement, the tank control looks good, and yield has increased. The cost of this improvement is more frequent testing and smaller, more frequent adds.
Step 3 : Show Some Improvement To show your continuous improvement, scroll down to an earlier date. Note where the limits changed, the wider spread, and the old Cpk.
Step 3 : Show Some Improvement Then scroll back to the top ... … you can show a tighter spread and a better Cpk.
Step 3 : Show Some Improvement + opportunity to improve for the next audit.