Download
1 / 26
260 likes | 414 Views
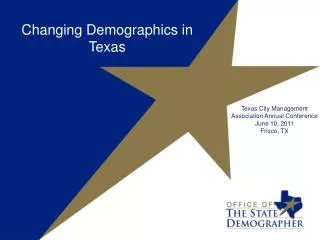
Texas and Bexar County Demographics. Promoting Adolescent & Child Health in San Antonio: A Community Roundtable November 5, 2010 University of the Incarnate Word San Antonio. TX. Fastest Growing States, 2000-2009. Natural Increase in Texas (Births minus Deaths).

E N D
Texas and Bexar County Demographics Promoting Adolescent & Child Health in San Antonio: A Community Roundtable November 5, 2010 University of the Incarnate Word San Antonio. TX
Natural Increase in Texas(Births minus Deaths) • Birth Rate: 16.8 per 1,000 vs. 14.0 for US (2ndhighest) • Death Rate: 6.8 per 1,000 vs. 8.3 for US (5thlowest) • Natural Increase: 10.0 per 1,000 vs. 5.7 for US (3rd highest) • Texas is young: • Median Age: 33.2 vs. 36.8 for US (2ndlowest) • Texas has a high total fertility rate (Children per woman) • 2.34 vs. 2.05 for US (4th highest) Source: National Center for Health Statistics, Vital Statistics Data, 2008http://wonder.cdc.gov/
Total Population and Components of Population Change in Texas, 1950-2009
Texas Racial and Ethnic Composition, • 2000 and 2009 Source: U.S. Census Bureau. 2000 Census count and 2009 Population Estimate
Estimated Total Population by County, 2009 Source: U.S. Census Bureau 2009 Population Estimates
Estimated Percent Non-Hispanic Anglo, 2009 Source: U.S. Census Bureau. 2009 Population Estimates
Estimated Percent Hispanic, 2009 Source: U.S. Census Bureau. 2009 Population Estimates
Percent Change of Total Population in Texas Counties, 2000-2009 Population increase for Texas was almost 19% during this period Source: U.S. Census Bureau. 2000 Census Count and 2009 Population Estimates
Projected Population Growth in Texas, 2000-2040 Year Source: Texas State Data Center 2008 Population Projections
Projected Racial and Ethnic Percent, Texas, 2000-2040 Source: Texas State Data Center 2008 Population Projections , 2000-2007 Migration Scenario
Educational attainment of persons 25+ years of age by ethnicity, Texas, 2009 Source: American Community Survey, 2009
Educational Attainment of persons aged 25 years and older, 2008
Projected Percent of Labor Force by Educational Attainment in Texas, 2000 and 2040
Adult Obesity Trends, 1995-2007 Source: Centers for Disease Control, BRFSS
Age and Obesity in Texas 1995, 2000, 2007 Source: Centers for Disease Control, BRFSS
Increasing Obesity Associated With… • Population growth • Population aging • Race and ethnic shifts • On-going lifestyle changes
Projected Increase in Number of Obese* Adults in Texas, 2006-2040 Source: Office of State Demographer, Moderate Projection *BMI>=30
Obesity in 2005 % adults with BMI >=30; State Data Center BRFSS Based Estimates, Metropolitan area + non-metro based rates
Results 2010-Moderate Scenario % adults with BMI >=30; Office of the State Demographer, 2000-2004 Projection
Results 2020-Moderate Scenario % adults with BMI >=30; Office of the State Demographer, 2000-2004 Projection
Projected number of obese in Bexar County % adults with BMI >=30; Office of the State Demographer, 2000-2004 Projection
Major Points • Texas’ population will continue to grow, driven by both natural increase and net migration (internal and international) • The Hispanic origin population contributes significantly to overall growth of Texas’ total population • Improving high school and college graduation rates is a significant challenge for Texas and Bexar County. • Obesity and morbidity associated with obesity are and will continue to be a significant issue for Texas and Bexar County
Contact Office: 512-463-7659 Email: Lloyd.Potter@utsa.edu Website: TXSDC.utsa.edu Lloyd Potter, Ph.D.