Download
1 / 1

E N D
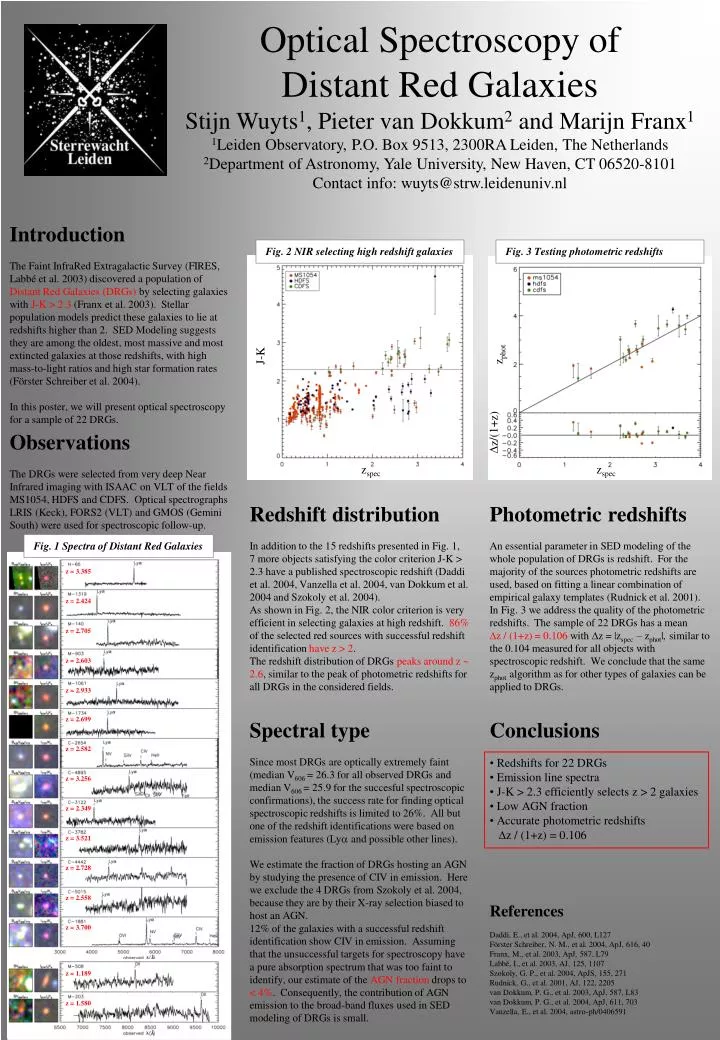
Fig. 3 Testing photometric redshifts Optical Spectroscopy ofDistant Red GalaxiesStijn Wuyts1, Pieter van Dokkum2 and Marijn Franx11Leiden Observatory, P.O. Box 9513, 2300RA Leiden, The Netherlands2Department of Astronomy, Yale University, New Haven, CT 06520-8101Contact info: wuyts@strw.leidenuniv.nl Introduction The Faint InfraRed Extragalactic Survey (FIRES, Labbé et al. 2003) discovered a population of Distant Red Galaxies (DRGs) by selecting galaxies with J-K > 2.3 (Franx et al. 2003). Stellar population models predict these galaxies to lie at redshifts higher than 2. SED Modeling suggests they are among the oldest, most massive and most extincted galaxies at those redshifts, with high mass-to-light ratios and high star formation rates (Förster Schreiber et al. 2004). In this poster, we will present optical spectroscopy for a sample of 22 DRGs. Fig. 2 NIR selecting high redshift galaxies zphot J-K z/(1+z) Observations The DRGs were selected from very deep Near Infrared imaging with ISAAC on VLT of the fields MS1054, HDFS and CDFS. Optical spectrographs LRIS (Keck), FORS2 (VLT) and GMOS (Gemini South) were used for spectroscopic follow-up. zspec zspec Redshift distribution In addition to the 15 redshifts presented in Fig. 1, 7 more objects satisfying the color criterion J-K > 2.3 have a published spectroscopic redshift (Daddi et al. 2004, Vanzella et al. 2004, van Dokkum et al. 2004 and Szokoly et al. 2004). As shown in Fig. 2, the NIR color criterion is very efficient in selecting galaxies at high redshift. 86% of the selected red sources with successful redshift identification have z > 2. The redshift distribution of DRGs peaks around z ~ 2.6, similar to the peak of photometric redshifts for all DRGs in the considered fields. Photometric redshifts An essential parameter in SED modeling of the whole population of DRGs is redshift. For the majority of the sources photometric redshifts are used, based on fitting a linear combination of empirical galaxy templates (Rudnick et al. 2001). In Fig. 3 we address the quality of the photometric redshifts. The sample of 22 DRGs has a mean z / (1+z) = 0.106 with z = |zspec – zphot|, similar to the 0.104 measured for all objects with spectroscopic redshift. We conclude that the same zphot algorithm as for other types of galaxies can be applied to DRGs. Fig. 1 Spectra of Distant Red Galaxies z = 3.385 z = 2.424 z = 2.705 z = 2.603 z = 2.933 z = 2.699 Spectral type Since most DRGs are optically extremely faint (median V606 = 26.3 for all observed DRGs and median V606 = 25.9 for the succesful spectroscopic confirmations), the success rate for finding optical spectroscopic redshifts is limited to 26%. All but one of the redshift identifications were based on emission features (Ly and possible other lines). We estimate the fraction of DRGs hosting an AGN by studying the presence of CIV in emission. Here we exclude the 4 DRGs from Szokoly et al. 2004, because they are by their X-ray selection biased to host an AGN. 12% of the galaxies with a successful redshift identification show CIV in emission. Assuming that the unsuccessful targets for spectroscopy have a pure absorption spectrum that was too faint to identify, our estimate of the AGN fraction drops to < 4%. Consequently, the contribution of AGN emission to the broad-band fluxes used in SED modeling of DRGs is small. • Conclusions • Redshifts for 22 DRGs • Emission line spectra • J-K > 2.3 efficiently selects z > 2 galaxies • Low AGN fraction • Accurate photometric redshiftsz / (1+z) = 0.106 z = 2.582 z = 3.256 z = 2.349 z = 3.521 z = 2.728 z = 2.558 References Daddi, E., et al. 2004, ApJ, 600, L127 Förster Schreiber, N. M., et al. 2004, ApJ, 616, 40 Franx, M., et al. 2003, ApJ, 587, L79 Labbé, I., et al. 2003, AJ, 125, 1107 Szokoly, G. P., et al. 2004, ApJS, 155, 271 Rudnick, G., et al. 2001, AJ, 122, 2205 van Dokkum, P. G., et al. 2003, ApJ, 587, L83 van Dokkum, P. G., et al. 2004, ApJ, 611, 703 Vanzella, E., et al. 2004, astro-ph/0406591 z = 3.700 z = 1.189 z = 1.580