Download

1 / 22
220 likes | 339 Views
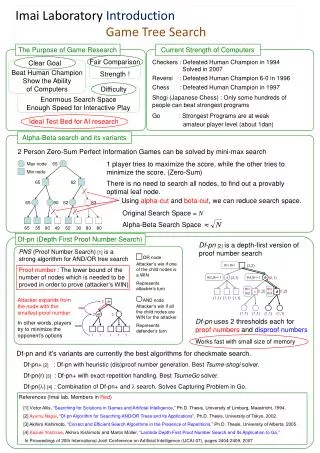
Iterative and Interactive Search for Objects. Moty Golan & Oren Kerem Instructor: Dr. Sigal Ar. Choose object. Search. Mark Results. Introduction. Databases of objects choose one working database choose object from the database arrange database by similarity to chosen object

E N D
Iterative and Interactive Search for Objects Moty Golan & Oren Kerem Instructor: Dr. Sigal Ar
Choose object Search Mark Results Introduction • Databases of objects • choose one working database • choose object from the database • arrange database by similarity to chosen object • Interactive: results can be marked as “good” or “bad” • Iterative: marked results used to refine the search
Databases • 3D objects’ surface • 10000 sampling points (no color) • Uniform distribution • Location of point and normal to the surface • 2D color pictures • Distinct families of pictures • HSV color representation
Objects’ Metric • Object representation - feature vector • Initial distance between objects - Euclidean distance: d(Dx , Dy) = || X - Y ||2 • Iterations: weighted Euclidean distance
Weights • Weighted distance : d(Dx , Dy) = [X - Y ]T W [X - Y] + b
Feature Vectors • Data of a certain type is extracted from the object • A vector of values is calculated based on the data • Feature type – the method of the values calculation • Moments • Histograms
Data Types • One aspect of the object is represented by a finite set of values • Naturally numerous aspects exist • For graphic object use visual aspects: • Pixels • Normals • Curvature • Color (HSV representation)
3D 2D Moments Histograms Moments Histograms points normals points normals curvature HSV points curvature HSVpoints Implemented Data and Feature Types
Goals • Organize the databases • Design an interface to enable searches on both databases using all parameters • Conduct searches to explore behavior
Organize_3dBase_Mom Read_Graphic_Body Extract_MomFeatures Create_Icon Compute_Moments Organizing the Databases • Extracting the data types • Calculation of feature vectors • Create object icons • Build directory hierarchy 3D Example:
Calculating Features • Normalize the data if needed • Ex. according to 1st & 2nd order moments • Calculate moment vectors according to desired orders • Calculate and flatten histograms • Save in appropriate files
Icons • “Flatten” and scale the 3D objects • Sub-sample the 2D objects
root sample 3d features images 2d 2d 3d 2d 3d 2d 3d Organized Databases
Interface Options • Select database: 2D / 3D • Choose object • Set search parameters • Feature kind and level • Data type • Conduct search • Database viewing & browsing • Full data display • Good and bad object marking
STARTING POINT Choose Object Button Program FlowDiagram CHOOSE OBJECT Choose Object Button ANYWHERE / Change Database Choose This Button WAITING TO SEARCH Change search parameters Search Button WAITING FOR MARKS Update Search Button Mark Results Button MARKING OBJECTS
Implementation: State Machine • Each program stage is a state: • Program waiting stages • Program action stages • User actions switch between states • In each waiting state the relevant options are made available while switch case a: ... case b: ... . . . end end
Legend empty command case user action INITIAL CASE 100 Cases Diagram … Choose This pressed Change Object / Database case 1 Change Parameters … 10 ANYWHERE Search pressed case 3 30 Update Search pressed case 2 Mark Results pressed Good Object pressed case 23 case 5 Bad Object pressed 50 case 25
Test Runs • Good results • Most tests converged within 3-4 iterations • Increase in “good” objects in each iteration • “Bad” objects removed from top 30 results • Limitations • Database variety • Computation demands vs. response time • Human perception vs. object representation
Feature Explorations • Higher feature levels do not guarantee better results • Completeness of representation does not guarantee better results • Some tests affected by feature type
Conclusions • Database arrangement and interface were implemented as shown • Various searches show that the algorithm successfully identifies classes of objects • Further research can include: • The effect of specific high feature levels • The effect of computation constants • Combining different feature types and levels