Download
1 / 27
270 likes | 447 Views
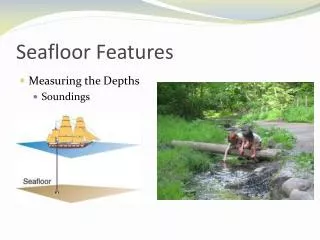
Mapping the Seafloor. Mapping the Seafloor. Depth Soundings The earliest soundings were made with a hand line of rope weighted at one end.

E N D
Mapping the Seafloor Depth Soundings • The earliest soundings were made with a hand line of rope weighted at one end. • Sticky tallow was often smeared on the weight to pick up sand and other sediments from the seafloor. The weight was then dropped overboard and the rope allowed to run free until the weight reached the bottom. • The length of the line let out was an approximate measurement of the water depth.
This type of sounding is only reliable only in calm, shallow areas Near continental shelves, in inland seas, and near med ocean islands. The first successful deep water soundings were made with large balls of twine. A heavy weight was attached and tossed overboard, pulling twine from the ball until it hit bottom. Then the ball of twine was cut from the weight and the twine that had run out. Because the weight of a length of twine was known, the depth of the ocean at that point could be determined.
Modern oceanographers use sophisticated remote-sensing techniques to gather data. The data is then plotted on charts and maps and used to create models that help us understand what seafloor features are like. In 1930 the echo-sounding sonar devices (fathometers) replaced sounding lines. The term SONAR is formed from the term sound navigation ranging. Sonar Soundings
Sonar works by sending out pulses of sound waves from a ship. Instruments record the time it takes for the sound waves to travel to the bottom, reflect, and return to the ship. Because the velocity of sound in seawater is known to be about 1,460 meters per second, the depth can be calculated. The speed does vary with the temperature and salinity in different regions of the ocean. Sonar Soundings cont.
The advantage of using sonar is that a vessel can keep moving at normal speed while soundings are made. Recording a series of soundings on a strip of paper or making a computer printout produces a two-dimensional visual profile also called an echogram or sonograph Research vessels cross the ocean making sonar profiles along navigated parallel course called transect lines. Only one beam is used. Sonar Soundings cont.
Echogram Sonograph
Developed in 1970’s Instead of a single line of sounding, this makes many measures of depth within a two-dimensional area of the seafloor. With swath mapping one transect the area sounded may be 10-60 km wide. Details are so clear that small scale features can be clearly identified. Features 10m across can be detected. Scientists use detailed swath mapping and image mapping to learn more about the processes that formed the sea floor. Swath Mapping
There 2 types of swath mapping: 1. multibeam sonar – sends out and tracks up to 16 closely spaced sonar beams at a time 2. side-scanning sonar – uses computers to translate the multiple echoes into detailed three dimensional images of the seafloor features
Claims to the Ocean • Nations considered the ocean open to everyone (Freedom of the Sea) • Ocean resources were available on a first come, first served basis. • In an effort to find fuel, food and minerals to be used by 6 billion people, 40% of the oceans have been claimed. • The claimed regions are called Zones. • Coastal nations claimed a territorial zone or sea of 3 nautical miles from shore. • They had full control of the zone but allowed nonmilitary commercial ships to pass through. • Many nations claim 12 nautical miles. This was complicated by straits.
1958 – United Nations agreed upon a “Law of the Sea” which provided for passage provisions for ships, subs and airplanes Today we have “Exclusive Economic Zones” Nations claim sovereign rights to all resources, living or nonliving up to 200 nautical miles from shore. The U.S. made their claim in 1958. The U.S. EEZ is larger than the land area of the U.S. Claims to the Ocean
The world’s EEZ zones, shown as a white extension of land territory.
By 1990 The two federal agencies, the U.S. Geological Survey and the National Oceanic and Atmospheric Administration, planned to complete swath mapping and assessment of the living and nonliving resources of the U.S.EEZ. It is not finished. In 1982 the new Law of the Sea Convention (LOSC) was written by the United Nations acknowledged the 12 mile territorial sea, making provisions for international straits and allows for 299 mile EEZ. All waters beyond the EEZ’s of nations are the High Seas and the seabed and subsoil beneath are called “the Area”. LOSC proposes that the U.N. administer the High Seas and the Area and that all nations share their ocean technologies and the wealth obtained from those technologies.
Today’s bathymetric maps of the ocean accurately show ocean depths determined by seismographic techniques.
Importance of Accurate Maps • Detailed, accurate maps and models of geological features are used by scientists to explain how the features of the earth form and how they change over time.
Bathymetric Maps • Data typically comes from a sonar mounted beneath or over the side of a boat, "pinging" a beam of sound downward at the seafloor. • The amount of time it takes for the sound or light to travel through the water, bounce off the seafloor, and return to the sounder tells the equipment what the distance to the seafloor is. • Data is supplied on the elevations and depressions of the ocean floor. • By drawing contour lines connecting points of equal depth, oceanographers have found that: • - the floor of the ocean has features like land-form features • undersea mountains, ridges and other masses
Contour Maps • Use colors to represent different elevations • Use shades of blue to show changes in depth. • Features above sea level are positive numbers • Features below sea level are negative numbers. http://academic.brooklyn.cuny.edu/geology/leveson/core/linksa/elevation.html
Practice with Contour Maps http://images.google.com/imgres?imgurl=http://www.compassdude.com/i/topographic-map.jpg&imgrefurl=http://www.compassdude.com/contour-quiz.shtml&usg=__4CtaFcJqaR3245QEHHtlIXe4uBI=&h=340&w=425&sz=25&hl=en&start=1&um=1&tbnid=OfWlKA2F3GBMOM:&tbnh=101&tbnw=126&prev=/images%3Fq%3Dcontour%2Bmap%26hl%3Den%26rlz%3D1B3DVFA_enUS226US229%26sa%3DN%26um%3D1
Three-Dimensional Maps • The most realistic maps are contour maps and three-dimensional raised relief maps. • Both use colors and shades to convey information about features. • Landform models can also be sculpted to show the effects of erosion, etc.