Download
1 / 18
200 likes | 412 Views
Production of Nitric Acid Environmental Impact Assessment. Erik Tolonen. Nick Poulin. Environmental Engineering Environmental Planning and Decision Making ENVE4104. Contents. Introduction Risk Assessment Fault Tree Event Tree. Introduction. Chemicals of Interest Ammonia (NH 3 )

E N D
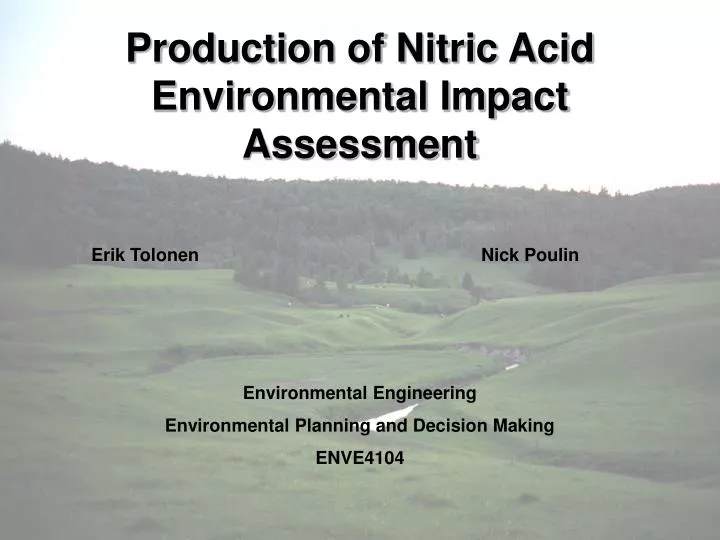
Production of Nitric Acid Environmental Impact Assessment Erik Tolonen Nick Poulin Environmental Engineering Environmental Planning and Decision Making ENVE4104
Contents Introduction Risk Assessment Fault Tree Event Tree
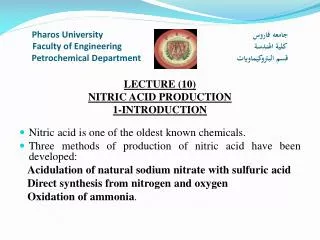
Introduction Chemicals of Interest • Ammonia (NH3) • Nitric Acid (HNO3) • Nitric Oxide (NO) • Nitrogen Dioxide (NO2) • Nitrous Oxide (N2O) Ammonia was determined to be the most hazardous chemical present in the process
Hazard Identification All chemicals are non-carcinogenic
Hazard IdentificationNH3 Human Health Effects • Causes irritation of the eyes, skin and respiratory system • No Observed Adverse Effect Level (NOAEL) – 6.4 mg/m3 • Lowest Observed Adverse Effect Level (LOAEL) – 17.4 mg/m3 • Respiratory lesions increase the severity of pneumonia and rhinitis Environmental Effects • Impact on certain types of plants and trees (reduced ability to retain water) Ammonia is considered to be toxic by the Canadian Environmental Protection Act
Wind Ingestion, Absorption Inhalation Nitric Acid Plant NH3 Rain Groundwater Exposure Assessment
Release of Ammonia Adults Advection Air River Advection/Dispersion Ground Water Advection/Dispersion Inhalation Ingestion, Absorption Adults/Children Adults/Children Ingestion, Absorption Transport Media Transport Mechanism Exposure Mechanism Population at Risk
Air Transport Model: Assumptions: - Transport by advection and dispersion only - Ammonia is released from a 20 m height stack with a 10 m plumb rise - Wind direction is directly towards the city (Worst Case Scenario) - No density or buoyancy effects Gaussian Model Parameters: - Atmosphere Stability Class D - Rate of Emission: 0.062 kg/s (223.2 kg/hr) over 30 hours - Total Amount of Ammonia Released: 6696 kg - Inhalation Reference Exposure Level: 0.3 ppm
Air Transport Model: Results: - Ammonia levels in the city will reach 0.3 ppm when emission rate reaches 80311.7 kg/s (80.3 tonnes/s). - Amount required is much greater then current release at plant
Water/Ground Water Transport Model: Assumptions: -Transport by advection only -Thoroughly mixed with river water -No retardation or attenuation present in soil Advection: -Flow time to reach city: 84.3 yrs -Flow time to reach river: 28.2 yrs • Solubility: • 42.8 wt % at 0 OC • - Amount of Ammonia entering groundwater insignificant
Exposure Assessment Intake Dose I = [CxCRxEFxED]/[BWxAT] C = Conc. at exposure point = 0.00008 ppm (0.00011mg/m3) CR = Contact Rate = 289.5 m3/hr = 6947 m3/day EF = Exposure Frequency = 1.25 days/year ED = Exposure Duration = 30 hrs = 0.003 year BW = Body Weight = 70 kg AT = 1.25 days I = 0.00003 mg/kg-day
Toxicity Assessment Case Studies (1) Soda Ash Facility Workers Exposed to Ammonia • No Observed Adverse Effect Level (NOAEL) – 9.2 ppm (6.4 mg/m3) (2) 344 Rats Exposed to Ammonia • Lowest Observed Adverse Effect Level (LOAEL) – 17.4 mg/m3
Risk Characterization Hazard Index for Ammonia HI = CDI/RfC CDI = chronic daily intake = RfC = reference dose = 0.3 ppm
Release of Ammonia to Environment OR AND OR OR OR OR OR Excessive concentration of NH3 in process Faulty equipment Loose pipe connections Excess ammonia inputted into system by plant operators Broken pipes Insufficient oxidation of ammonia Improper upkeep or maintenance by plant operators Improper upkeep or maintenance by plant operators Excess pressure within pipes Loose connection at ammonia input port Insufficient air supplied to ammonia converter Improper operating temperature or pressure Miscalculation of required ammonia Improperly calibrated measuring instruments Fault Tree
Source Transport Media Transfer Mech Exposure Mech Receptors Exposure Route Nitric Acid Production Process Air -Critical Water Soil Washout by rain Volatilization Uptake by plants Ambient air Drinking water wells Consumption of food Anyone breathing the air Users of well water Humans, animals that eat the plants Inhalation Ingestion, Absorption Ingestion Event Tree
Conclusions Conclusions