Download
1 / 59
590 likes | 687 Views
(Systeme International). Branches of Earth Science. Geology Study of the origin, history, and structure of the earth Meteorology Study atmosphere, especially weather & weather conditions. Oceanography Study of the ocean and its phenomena 4. Astronomy

E N D
Branches of Earth Science • Geology Study of the origin, history, and structure of the earth • Meteorology Study atmosphere, especially weather & weather conditions
Oceanography Study of the ocean and its phenomena 4. Astronomy Study of the position, composition of stars, planets & other objects
Earth’s 4 Spheres Geosphere/
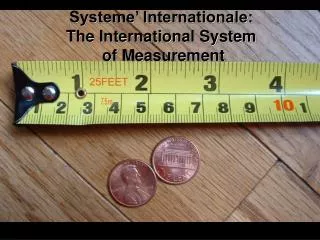
Metric System (SI System) • The Universal language of measurement • Easily communicated to others • Decimal system based on the number 10 Used to measure length, volume, mass, weight, density and temperature
Only 3 countries do NOT use the metric system United States, Burma & Liberia
Kilo HectoDecaBASEDeciCentiMilli“King Henry Died By drinking chocolate milk” M 1000 Hecto D (sometimes da) 1/10 Centi 1/1000 Micro
Kilo HectoDecaBASEDeciCentiMilli 1000X 1000X 10X 1X 1/10X 100X 1/100X K H D g, m, L d c m “King Henry Died By drinking chocolate milk”
Length: Measurement of distance between two points. 1000m 1/1000m 1,000,000m 1/100m # is SMALLER K H D B d c m # is LARGER basic unit is the meter Kilometer – Millimeter – Megameter – Centimeter –
MASS: the amount of matter in an object. Basic unit is the gram (g) • Nickel = 5 g • Person 52 kg What is the difference between mass and weight? Weight is the force which a given mass feels due to the gravity at its place. (F = m x a)
VOLUME: Measure of the amount of liquid material • Basic unit is the Liter (L) • 1 can of coke is 355 mL • 1 large Nalgene bottle is 1L
DENSITY: used to compare substances based on mass and volume. • Basic unit is g/mL • Density = mass/volume (D=M/V) Example an unknown sample: Mass = 1g and Volume = 1 mL D = 1g/1mL = 1g/mL FYI: 1 mL = 1cm3 SAME MASS BUT DIFFERENT VOLUMES! WHAT HAPPENED TO THE DENSITY? WATER!
TEMPERATURE • Average kinetic energy in atoms. • Measured in degrees Celsiusor Kelvin • C K K = C + 273 • K C C = K – 273 • C= 5/9 (F-32) • F= 9/5 C +32 • Water boils at 100C • Water freezes at 0C • Body Temp 37C
PLEASE GET OUT A BLANK SHEET OF PAPER…. TIME TO DRAW A…. SCIENTIST!!!
How many of your drawings portrayed a scientist that… • Is male? • Is female? • Is wearing glasses? • Is wearing a lab coat? • Has crazy hair? • Is holding lab equipment? • Is holding/around animals? • Is white? 9. Asian? 10. African-American?
Albert Einstein Theoretical Physicist Best known for… E=MC2
Charles DarwinNaturalistBest known for…The voyage of the BeagleThe Origin of SpeciesNatural Selection
Nikola TeslaInventor and Electrical EngineerKnown for… Birth of commercial electricity (electricity and magnetism)
Marie CuriePhysicist, ChemistKnown for….Pioneer work in RadioactivityDiscovered Polonium and Radium2 Nobel Prizes
George Washington CarverBotanist, InventorKnown for…Crop rotation- revolutionized southern farming (peanuts & sweet potatoes).
Dr. Charles DrewPhysician & ResearcherKnown for…Developing blood banks early in WWII
Rachel Carson Marine Biologist helped advance the environmental movement. Best Known For…. Silent Spring Led to the formation of the EPA.
Rosalind FranklinBiophysicistX-ray CrystallographerKnown for….X-ray images of DNA.
Jane GoodallPrimatologistEthologistAnthropolgistKnown for…. 45 year study of chimpanzee social and family interactions
One more…. YOU!!!
Methods of Science To answer questions, scientists use many approaches, but they all use common steps – SCIENTIFIC METHOD • Problem/Question Develop a question or problem that can be solved through experimentation 2. Observation/Research Make observations and research your topic of interest.
3. Hypothesis Possible explanation for the problem. - Must be testable! - Example: If soil temperatures rise, then plant growth will increase. 4. Experiment Develop a procedure to test your hypothesis. Must be measurable (quantifiable).
5. Collect & Analyze Results/Data - Data is information obtained from an experiment - Can disprove or prove a hypothesis - Include tables, graphs & photographs - Numbers, descriptors 6.Conclusion - Statement that accepts or rejects the hypothesis - Make recommendations for further study
Experimental Variables • Independent Variable • On theXaxis • Intentionally manipulated variable • Ex: John is going to use 25 g, 50g, 100g and 250g of sugar in his experiment • Dependent Variable • On the Y axis • Factor that may change as a result of changes made in the independent variable • Ex: Size of the loaf of bread based on amount of sugar used.
Control & Experimental Groups • Control Group • Serves as the standard of comparison • No treatment given- control group is exposed to the same conditions as the experimental group (except for the variable being tested). • Experimental Group • Independent variable is changed • Ex: temperature or water given to a plant
Scientific Method Practice Work on the scientific method pages in your packet. When you finish, work on the review page. TEST ________ REVIEW SHEET & PACKET are DUE at the TEST
Representing Data Graphing- A visual representation of data collected in an experiment 1. Line Shows trends easily
2. Bar Shows counts. 3. Pie Shows percent of a whole.
4. Pictograph uses images to depict information If I wanted to make a graph of how much rainfall occurred in each month, how should I plot my data for a bar graph? (What should be put on the X and Y axis?)
ALWAYS USE… L I N T ABELS NTERVALS UMBERS ITLE
UNIT ONE TEST IS ON _______ • PACKET IS DUE AT THE TEST • REVIEW PAGE IS DUE FOR A QUIZ GRADE AT THE TEST
1 2 3 MetersLitersGrams How do you use the “ladder” method? 1st – Determine your starting point. 2nd – Count the “jumps” to your ending point. 3rd – Move the decimal the same number of jumps in the same direction. Starting Point Ending Point __. __. __. 2 3 1 Ladder Method KILO1000Units HECTO100Units DEKA10Units DECI0.1Unit CENTI0.01Unit MILLI0.001Unit 4 km = _________ m How many jumps does it take? 4. = 4000 m