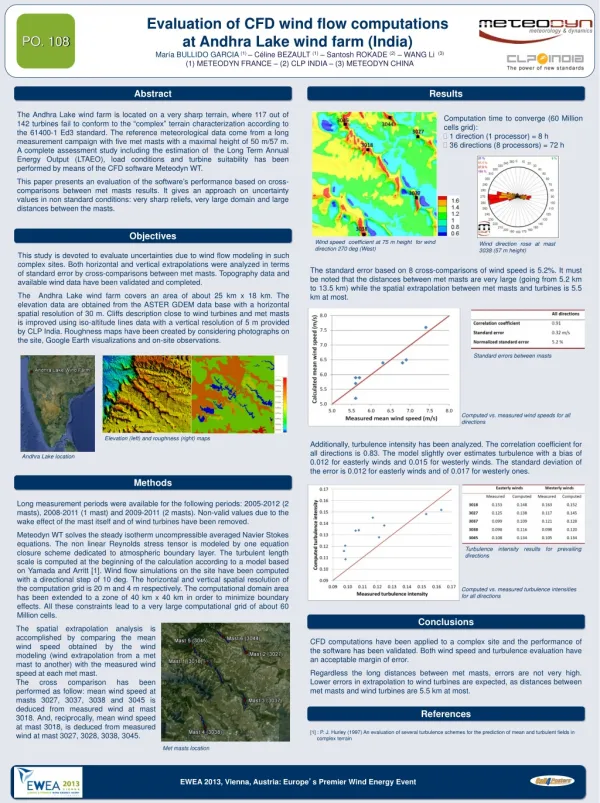
Download
1 / 20
270 likes | 466 Views
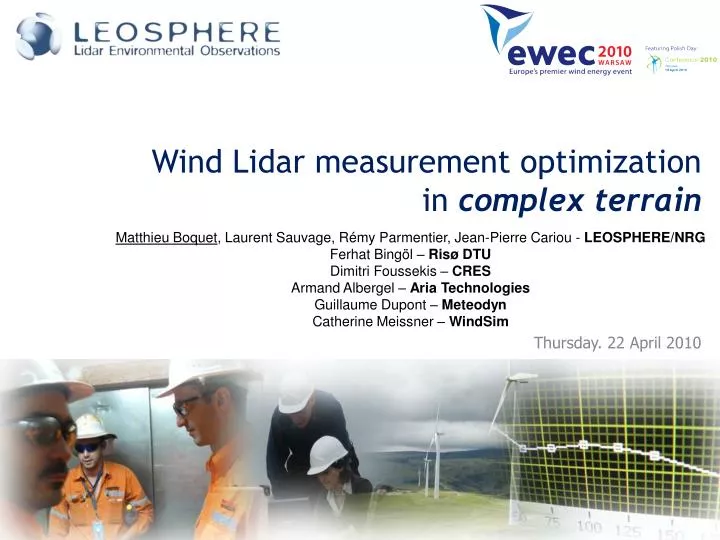
Wind Lidar measurement optimization in complex terrain. Matthieu Boquet , Laurent Sauvage, Rémy Parmentier, Jean-Pierre Cariou - LEOSPHERE/NRG Ferhat Bingöl – Risø DTU Dimitri Foussekis – CRES Armand Albergel – Aria Technologies Guillaume Dupont – Meteodyn

E N D
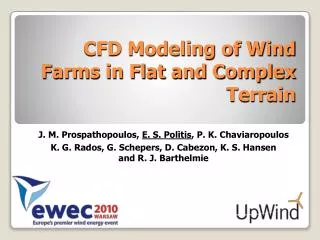
Wind Lidar measurement optimizationin complex terrain Matthieu Boquet, Laurent Sauvage, Rémy Parmentier, Jean-Pierre Cariou- LEOSPHERE/NRG Ferhat Bingöl – Risø DTU Dimitri Foussekis – CRES Armand Albergel – Aria Technologies Guillaume Dupont – Meteodyn Catherine Meissner – WindSim
Agenda • Introduction: complex terrain requirements • Wind Lidar volume measurement vs. cups point measurement: assumptions for direct comparison and validity of these assumptions • CFD modeling and WindCube measurement process simulation • Geometrical optimization and CFD combination for improving Lidar measurement in complex terrains • Conclusions
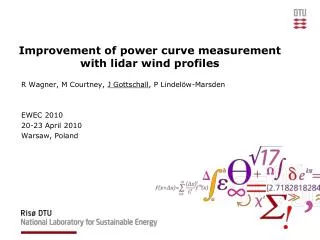
Wind Resource Assessment Program • Estimate the wind speed distribution: • On-site measurement: masts and remote sensors • Meteorological stations and airports records • Flow modeling software to extend measurements both in space (hub height and turbines location) and time (long-term scaling) • In complex terrain: • Requires more on-site measurement locations to gain certainty in the WS estimation • A remote sensor is a precious complementary system: • But performances need to reach cup standards, i.e. bias<2%
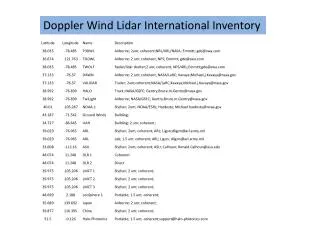
Pulsed Wind Lidar principle How and How well Does the WindCubeTM retrieve wind Velocity vertical profiles?
Lidar volume measurement principle • Pulse length and beam width • Conically scanning Probed volumes are away one from another • Sequentially scanning +10m -10m
Radial velocities measurement aerosols vrad=v.axisbeam • Radial velocity is the projection of aerosols velocity on laser beam axis • Flow homogeneity assumption: aerosols velocity is the same at every radial velocity measurement location • U, V and W can be resolved v q vrad Laser shooting direction
Terrain complexity influence Terrain slope10° Lidar + mast Forest At Risø test site Høvsøre (onshore 1st phase of Norsewind Project) Observed relative difference:~1% Observed relative difference:~2% Observed relative difference:~6%
CFD Modeling analysis USING a cfd modeling to better understand the lidar and anemometer differences in complex terrain
Complex Spanish site • MERCURE/Aria Technologies • CFD model adapted to complex topography • Stationary CFD: A study of Lidar wind velocity retrieval process under various distorted flow conditions • Simulation of Lidar measurement process with MatLab North-Westwind WindCube Met mast North-Westwind
Lidar vs. cup simulation • Terrain elevation represented with colors • Black stars: locations of Lidar and cup measurement simulation Lidar underestimation <-5% Lidar overestimation >5% North-West Wind
Horizontal gradient of vertical wind speed dependency Lidar-cup relative difference vs. horizontal gradient of the horizontal wind speed No dependency Lidar-cup relative difference vs. horizontal gradient of the vertical wind speed Clearly correlated
Geometrical Optimisation How can we modify the lidar measurement process to get closer to cup?
Reducing the scanning cone ? • Probing a smaller volume then more homogeneous ? No! At a given height, difference depends only on horizontal gradient of vertical wind speed Source of Bias Radial vel. W1 W3 W2 U U U Radial vel. • No magical scanning cone angle • Dangerous below 15° and above 30°
30° vs. 15° - CRES data 30° cone angle 15° cone angle
Adding more lines of sight ? • Consider first order variation of wind speed • As new unknown variables are introduced, one should add new Lidar equations to retrieve them • However, a line of sight LOSi gives the radial velocity Si: • No LOS brings info on Wi
Lidar-CFD combination Could a cfd model bring the missing info?
Using a model to correct Lidar data • Model can provide the essential site specific info on the vertical wind speed distribution to correct Lidar data Modeling Relative difference on site Relative difference with corrected Lidar
Methodology validation • Meteodyn WT and WindSim correction add-on tested on 2EN and CRES WindCubes on complex Greek site CFD combination gets the bias from 6% down to 1%
Conclusion • Point and volume measurement leads to wind speed value differences in complex terrain • Vertical wind speed loss of homogeneity is the main source of error • Scanning cone angles between 15°-30° act similarly for horizontal wind speed • More lines of sight are not more useful info • Meteodyn WT and WindSim add-on: WINDCUBE®Lidars data are now quantitatively useable on all types of terrain
Questions ? www.leosphere.com mboquet@leosphere.fr