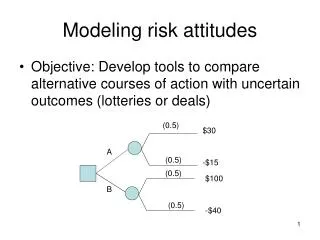
Download
1 / 16
160 likes | 261 Views
Infectivity based risk modeling. Nico Lelie. Chiron, France. 1:133 dilution iatrogen serum (CF titre 1:1280) in 130L plasma pool (CF titre1:10). LF Barker and R Murray AJMS, 1972: 263;27-33. ~ 10 geq?. 2/5(40%). 3/5(60%). 2/5(40%). ~ 10 4 geq?. 1/5(20%). 3/5(60%). 2/5(20%).

E N D
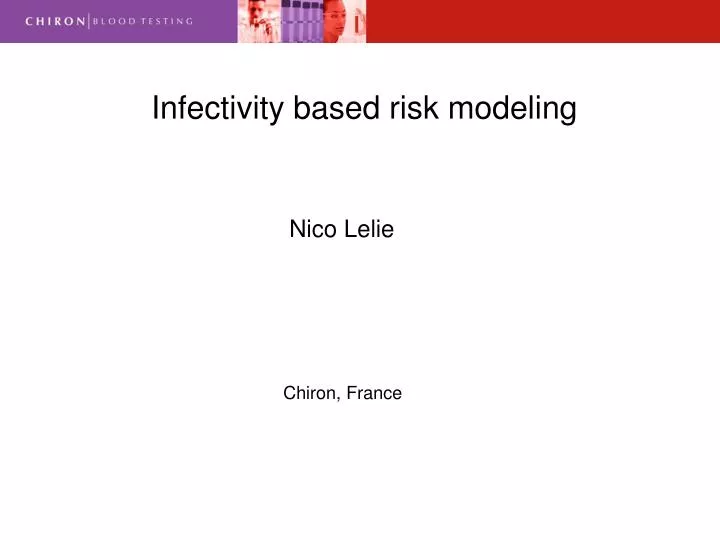
Infectivity based risk modeling Nico Lelie Chiron, France
1:133 dilution iatrogen serum (CF titre 1:1280) in 130L plasma pool (CF titre1:10) LF Barker and R Murray AJMS, 1972: 263;27-33 ~ 10 geq? 2/5(40%) 3/5(60%) 2/5(40%) ~ 104 geq? 1/5(20%) 3/5(60%) 2/5(20%) 3/5(60%) 22/37(59%) 25/37(68%)
HBV Analytical Standards Analytical standards Relation IU to genome equivalents and infectious dose HBV (NAT) HBsAg 1 IU ~ 7,5 geq1 ~ 5 cps2 1VQC standard, 2Bayer Versant bDNA3.0 1 CID50 ~ 10 geq3 3Yoshizawa et al 1 IU ~ 0,5 ng (PEI) ~ 1,9 ng (AFSSAPS) Pictures Prof. Gerlich
Early viral dynamics Increase of virus concentration(C) in early ramp up phase of window geq/ml C=Co 2t/l l= 0.45 days . . . l = 0.85 days l = 2.56 days days doubling times:Glynn et al, Transfusion, 2005;45:994, Fiebig et al, AIDS 2003;17:1871 Biswas et al, Transfusion 2003,43:788
HIV window phase Probability of HIV-RNA detection during onset viraemia ~ 4 days MP-TMA (1:16) ID-TMA delta days
Mathematical model Probability nonRNA/DNA detection during window phase (Weusten et al, Transfusion 2002, 42, 537) 100 copies 1 copy
Viral load and infectivity Relation between viral nucleic acid concentration and infectivity titre • Virus plasma source immune genomes per ref. • complex infectious dosea • HBV chronic carrier - 10-100 1,2,8 • HCV acute phase,H-strain - 10-100 3,4,7 • chronic phase + >1000 3 • F-strain + >10000 4 • HIV window - 1000-100000 5,6 • infectious dose HBV : CID50 , HCV: CID50,, HIV : 1 CID50= 1-10 TCID50 • References • Berninger et al, J. Med. Virol. (1982) 9:57-68 • Ulrich et al J Infect Dis. (1989) 160: 37-43 • Hijikata et al. J. Virol. (1993) 67:1953 • Alter et al. J. Viral Hep. (1995) 2:121-132 • Piatak et al, Science (1993) 259:1749-1754 • Prince et al. PNAS (1988) 85:6944-6948 • Katayma K. Intervirology 2004;47:57-64 • Yoshizawa et al, to be published
HIV MP NAT breakthrough HIV transmission cases by transfusion after introduction mini-pool NAT • Assuming ~30 ml plasma in red cell concentrate • 120 geq/ml in limiting dilution analysis with VQC genotype E standard.
borderline infectious HIV Proportion of HIV-RNA positives in dilutions of differential infectious window phase plasma (South Africa)
HIV infectivity HIV: production of defective virus? cell capsid virus RNA
HIV infection risk Probability of infection in window risk HBV 100% HIV HCV 50% 10 100 1000 [geq/ml] Probability of infection HCV / HBV Probability of infection HIV
Residual HIV window phase ‘risk days’ 15 days 9 days 7 days 5,6 days 1 copy/20 ml day 0 ID-NAT day 5,6 MP-NAT day 9 p24 Ag day 15 Anti-HIV day 22 Busch et al, Transfusion 2005;45:254 3,2 ‘risk days’ 6,5 ‘risk days’ 0,2 ‘risk days’ 7 days 1 copy/20 ml day 0 ID-NAT day 5,6 MP-NAT day 9 p24 Ag day 15 Anti-HIV day 22 Weusten et al, Transfusion 2002;42:537
ID-NAT risk reduction Residual window phase ‘risk days’ of viral transmission by NAT screened red cell transfusionsbased on mathematical model Weusten et al (Transfusion 2002, 42, 537) on PeliCheck analytical sensitivity data in geq/ml published by Koppelman et al, Transfusion 2005;45:1258-66 and Vox Sang 2005;89: 193-20020 ml plasma in red cell concentrate 2 x 40 x 80 x 1) based on HBsAg sensitivity of 2000 geg/ml 2) based on anti-HIV screening 22 days, based on HIV-Ag testing with 10.000 geq/ml sensitivity 6,5 days 3) Based on anti-HCV screening
Infectivity of blood serology antigen antibody NAT infectivity T = 0 eclipse low high medium low neutralized relative concentration antibody virus antigen detection limit infectivity threshold NAT detection limit infectivity threshold
HIV yield in RSA - + + 311 (94,0%) 8 (2,4%) 12 (3,6%) - Diagnostic Sensitivity Tigris and PRISM in 312,033 donations in RSA Ultrio/dHIV reactive non specific? non infectious? infectious window phase PRISM anti-HIV reactive 311,702
ID-NAT risk reduction Infectivity based risk modeling with ID-NAT(red cell transfusions) • rest infectious window period: • HIV ~ 0-0,5 days • HCV ~ 1-2 days • HBV ~ 1-2 weeks • window phase risk reduction factor to serology: • HBV ~ 2 x • HCV ~ 40 x • HIV ~ 80 x • significant risk reduction occult HBV transmission • infectivity ID-NAT negative ‘serology yield’ questionable • ID-NAT negative low infectious transfusions may not have clinical consequences