Download
1 / 24
240 likes | 248 Views
Data Use & Interpretation for MESH. January 27, 2016. Session Goals. Introduce 6 Steps in data use & interpretation that you can use in your mentorship Brainstorm ideas about how you can incorporate these into your daily work. 2. Step #1: Get to know your data.

E N D
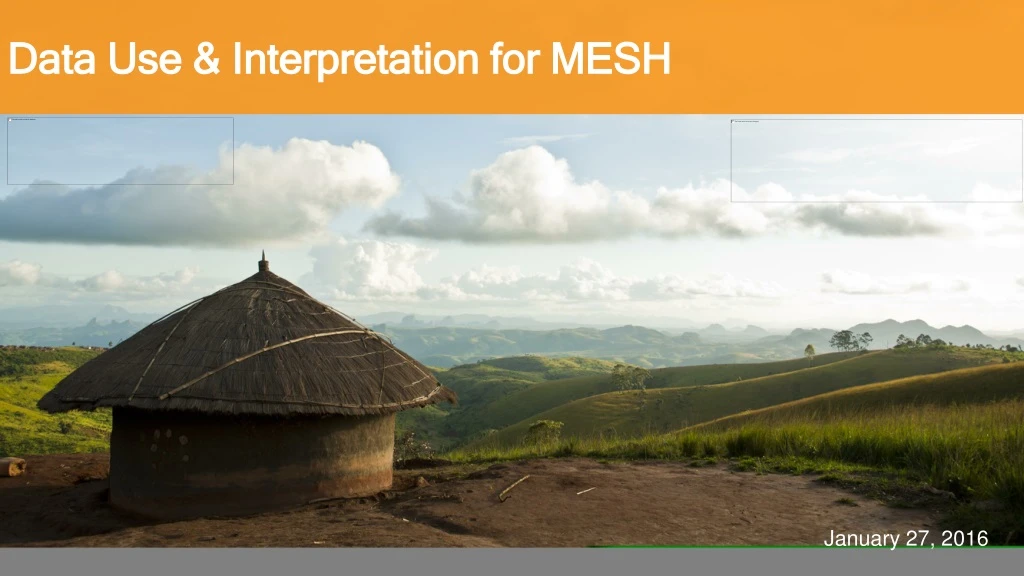
Data Use & Interpretation for MESH January 27, 2016
Session Goals Introduce 6 Steps in data use & interpretation that you can use in your mentorship Brainstorm ideas about how you can incorporate these into your daily work 2
Step #1: Get to know your data • What kinds of data do you have? • Inputs data • Outputs data (service quality and uptake) • Outcomes data (patient health) • Costing data • Indicator: A specific measurement that provides information on the state or condition of something • What can we learn from the data? • What can’t we learn from the data? 3
Step #2: Define “Success” • For the indicators in your data set, what is a “good” outcome or a “needs improvement” outcome? • What is the ideal goal or “aspirational target” for each key indicator? • What is a feasible goal for short-term progress towards the ideal goal? • What do you need to know in order to decide what is feasible? 4
Exercise: Identifying Targets • Choose some indicators from the clinical program and determine: • What is the “ideal target” for each indicator? • What is a feasible target to set for next year for each indicator? • Can you explain how you decided the next year’s target? 5
Step #3: Verify Data Quality • The “4 C’s” of Data Quality: • Completeness • Correctness • Consistency • Concordance 6
Why do we care about data quality? • Having accurate and reliable data on program results allows us to: • Show accountability • Monitor progress toward meeting established goals and targets • Provide decision-makers with information required for planning, resource allocation, program design, and program improvement 7
What happens with poor data quality? Programs suffering from poor data quality may: • Have to use additional resources to correct the data • Experience reduced stakeholder confidence and support • Miss opportunities to identify areas of strength or gaps in program activities • Make ineffective or inappropriate programmatic decisions based on poor data 8
4 C’s: Completeness • Have all data been submitted? • E.g. missing reports from a health center, a provider, a CHW • How complete are specific data elements within a report that’s been submitted? • Calculation: What proportion of the data are missing values? • E.g. how many facilities in 2011 failed to report the number of new ANC registrations? 10
4 C’s: Correctness • Is the data POSSIBLE? • Could this happen in reality? 11
4 C’s: Consistency • Possible, but unlikely • “wacky” values • Outliers, suspicious changes 12
4 C’s: Concordance • Do different data sources “agree” each other? • Example 1: # of HIV tests for pregnant women in lab register vs. ANC register • Example 2: # of HIV patients with a viral load result in paper dossiers vs. EMR • What is the appropriate level of “agreement?” 13
How we measure data quality? • Is it complete? • Is it valid? • Is it reliable? • Is it accurate? 15
Step #4: Investigate • Dive deeper: what do the data tell us about a program’s strengths and areas for improvement? • Key Concept: positive outliers, “bright spots” 17
Step #5: Prioritize • Of all the challenges shown by the data, which ones are: • Easiest to act upon given current resources (“low-hanging mangos”)? • Most importantfor program quality? • Of all the strengths shown by the data, which ones are: • Potentially most feasibleto replicate in other programs/sites? • Most important for program quality? 18
Exercise: Prioritze • Choosing from our targets in step 2, pick 2 indicators that you want to follow up on first. • One should be a challengethat you want to work on improving, • The other should be a strengththat you want to try to expand on or replicate. • Be ready to explain your choice to the group. 19
Step #6: Communicate & Utilize • Decide who should know about this issue • Who has decision-making authority? • Who will need to participate in any next steps? • Decide what they need to know • What level of detail? • How can you show them that the issue is important? • Decide when will be the right timing to discuss this issue 20
Questions to ask during Analysis • Are the results what you would have expected to see? • What there anything that surprised you in the data? • Are there important trends that should be discussed? • Were there things happening in the program, or District, that may have affected the data? • For example, staff turnover • Are there questions you have that you can’t answer based on the data available or your experience as a mentor? • These are your limitations 21
Remember the Influence of your Data • Data from observational checklists and activity logs is used to track program activities and outcomes over time • Is performance improving in a district? • Which health centers were visited? • Which health centers may be lagging behind? 22
…And use it for decision-making • Allows us to target our work to specific needs • Provides us with ways to describe what we are seeing to others • Allows us to see if we are getting better (or worse) 23
Thank you for your hard work & dedication to health and human rights! Matilda Nikolasi talks with PIH clinician Joe Lusaka and was the first of many to be served during the new Dambe Health Center’s first day on April 25, 2016 in Malawi. She was screened for Hypertension, HIV and Diabetes during this visit through the SHARF (Screening for health and referrals at the facilities) initiative. (Photo by Nandi Bwanali / Partners In Health) 24