Download
1 / 28
290 likes | 587 Views
River Hydrographs. Why do we use hydrographs?. To find out discharge patterns of a particular drainage basin. Help predict flooding events, therefore influence implementation of flood prevention measures. Hydrographs. Record of River Discharge over a period of time

E N D
River Hydrographs Why do we use hydrographs? • To find out discharge patterns of • a particular drainage basin • Help predict flooding events, • therefore influence implementation of flood prevention measures
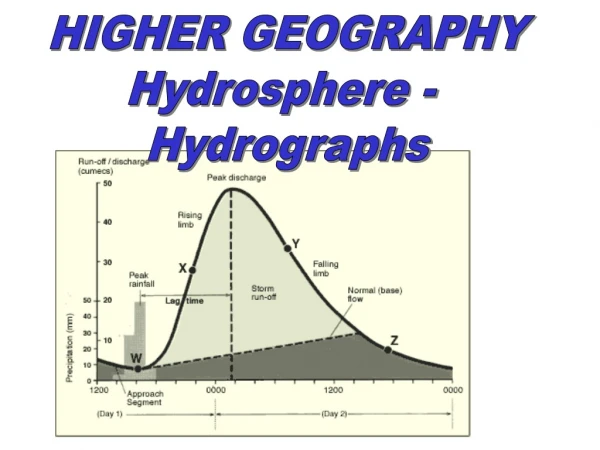
Hydrographs Record of River Discharge over a period of time The discharge of a river is the volume of water which flows through it in a given time. It is usually measured in cubic meters per second
Basin lag time Peak flow Flood Hydrograph 3 Rising limb Overland flow Recession limb 2 mm Discharge (m3/s) 4 Through flow 1 3 2 Base flow 0 12 24 36 48 30 72 Hours from start of rain storm
3 2 Discharge (m3/s) 1 0 12 24 36 48 30 72 Hours from start of rain storm
Rainfall shown in mm, as a bar graph 3 2 mm Discharge (m3/s) 4 1 3 2 0 12 24 36 48 30 72 Hours from start of rain storm
Discharge in m3/s, as a line graph 3 2 mm Discharge (m3/s) 4 1 3 2 0 12 24 36 48 30 72 Hours from start of rain storm
Rising limb The rising flood water in the river 3 Rising limb 2 mm Discharge (m3/s) 4 1 3 2 0 12 24 36 48 30 72 Hours from start of rain storm
Peak flow Peak flow Maximum discharge in the river 3 Rising limb 2 mm Discharge (m3/s) 4 1 3 2 0 12 24 36 48 30 72 Hours from start of rain storm
Recession limb Peak flow Falling flood water in the river 3 Rising limb Recession limb 2 mm Discharge (m3/s) 4 1 3 2 0 12 24 36 48 30 72 Hours from start of rain storm
Basin lag time Basin lag time Peak flow Time difference between the peak of the rain storm and the peak flow of the river 3 Rising limb Recession limb 2 mm Discharge (m3/s) 4 1 3 2 0 12 24 36 48 30 72 Hours from start of rain storm
Base flow Basin lag time Peak flow Normal discharge of the river 3 Rising limb Recession limb 2 mm Discharge (m3/s) 4 1 3 2 Base flow 0 12 24 36 48 30 72 Hours from start of rain storm
Overland flow Basin lag time + Peak flow Through flow 3 = Rising limb Overland flow Recession limb 2 Storm Flow mm Discharge (m3/s) 4 Through flow 1 3 2 Base flow 0 12 24 36 48 30 72 Hours from start of rain storm
Overland flow Through flow Volume of water reaching the river from surface run off Volume of water reaching the river through the soil and underlying rock layers
Factors influencing Hydrographs • Area • Shape • Slope • Rock Type • Soil • Land Use • Drainage Density • Precipitation / Temp • Tidal Conditions When interpreting hydrographs all factors must be considered together
Here are some theoretical interpretations of influencing factors BUT… When interpreting hydrographs all factors must be considered together
Area Large basins receive more precipitation than small basins therefore have larger runoff Larger size means longer lag time as water has a longer distance to travel to reach the trunk river Area Rock Type Drainage Density Shape Soil Precipitation / Temp Slope Land Use
Shape Elongated basin will produce a lower peak flow and longer lag time than a circular one of the same size Area Rock Type Drainage Density Shape Soil Precipitation / Temp Slope Land Use
Slope Channel flow can be faster down a steep slope therefore steeper rising limb and shorter lag time Area Rock Type Drainage Density Shape Soil Precipitation / Temp Slope Land Use
Rock Type Permeable rocks mean rapid infiltration and little overland flow therefore shallow rising limb Area Rock Type Drainage Density Shape Soil Precipitation / Temp Slope Land Use
Soil Infiltration is generally greater on thick soil, although less porous soils eg. clay act as impermeable layers The more infiltration occurs the longer the lag time and shallower the rising limb Area Rock Type Drainage Density Shape Soil Precipitation / Temp Slope Land Use
Land Use Urbanisation - concrete and tarmac form impermeable surfaces, creating a steep rising limb and shortening the time lag Afforestation - intercepts the precipitation, creating a shallow rising limb and lengthening the time lag Area Rock Type Drainage Density Shape Soil Precipitation / Temp Slope Land Use
Drainage Density A higher density will allow rapid overland flow Area Rock Type Drainage Density Shape Soil Precipitation / Temp Slope Land Use
Precipitation & Temperature Short intense rainstorms can produce rapid overland flow and steep rising limb If there have been extreme temperatures, the ground can be hard (either baked or frozen) causing rapid surface run off Snow on the ground can act as a store producing a long lag time and shallow rising limb. Once a thaw sets in the rising limb will become steep Area Rock Type Drainage Density Shape Soil Precipitation / Temp Slope Land Use
The size, shape and relief of the basin are important controls. Water takes longer to reach the trunk stream in a large, round basin than in does in a small, narrow one.
Where gradients are steep, water runs off faster, reaches the river more quickly and causes a steep rising limb. Prolonged heavy rain causes more overland flow than light drizzly rain.
Areas of permeable rocks and soil allow more infiltration and so less surface run off.
The way in which the land is used will also have an influence on the hydrograph – vegetation intercepts precipitation and allows evaporation to take place directly into the atmosphere so reducing the amount of water available for overland flow while the large number of impermeable surfaces in urban areas encourages run off into gutters and drains carrying water quickly to the nearest river.


![Hydrographs [Date] Today I will: - Be able to construct and understand flood hydrographs](https://cdn3.slideserve.com/5580541/hydrographs-date-today-i-will-be-able-to-construct-and-understand-flood-hydrographs-dt.jpg)