Download
1 / 1

E N D
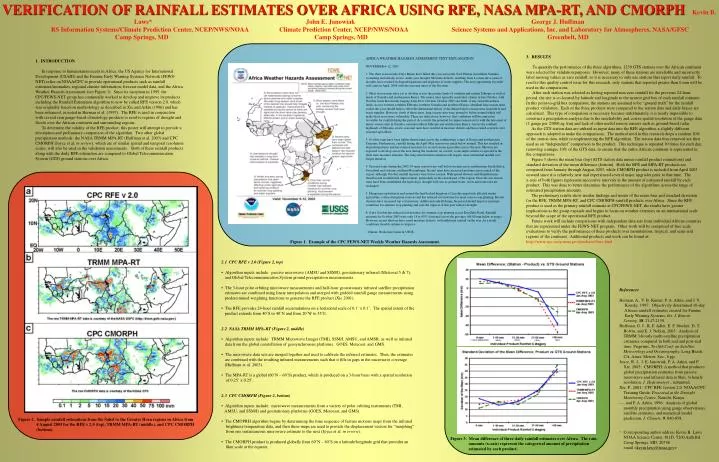
VERIFICATION OF RAINFALL ESTIMATES OVER AFRICA USING RFE, NASA MPA-RT, AND CMORPH Kevin B. Laws* John E. Janowiak George J. Huffman RS Information Systems/Climate Prediction Center, NCEP/NWS/NOAA Climate Prediction Center, NCEP/NWS/NOAA Science Systems and Applications, Inc. and Laboratory for Atmospheres, NASA/GFSC Camp Springs, MD Camp Springs, MD Greenbelt, MD AFRICA WEATHER HAZARDS ASSESSMENT TEXT EXPLANATIONNOVEMBER 6-12, 2003 1. The short season rains (Deyr Rains) have failed this year across the Sool Plateau in northern Somalia, worsening and already severe, multi-year drought. Moisture deficits, resulting from 4 consecutive years of drought, have resulted in degraded pastures and depletion of water supplies. The next opportunity for relief will come in April, 2004 with the seasonal onset of the Gu rains. 2. Short season rains have yet to develop across the pasture lands of southern and eastern Ethiopia as well as much of Somalia and northeastern Kenya. The minor rains typically reach their climax in late October, with October totals historically ranging from 40 to 100 mm. October 2003 saw little, if any, rain fall on these lands. Across extreme southern Ethiopia, southern Somalia and northeast Kenya, abundant long season rains earlier this year should help to offset the detrimental effects of the delayed short season rains on pastures and water supplies. However, north of these areas, long season rains were normal to below normal which will make these areas more vulnerable. There are indications, however, that conditions will become more favorable for rainfall during the period. As a result, the potential for improvement exists with the late onset of minor season rains in Somalia, eastern/southern Ethiopia and northeastern Kenya. Across the southern highlands of Ethiopia, erratic seasonal rains have resulted in moisture deficits and have raised concerns over seasonal agriculture. 3. October rains have been lighter than normal across the southeastern corner of Kenya and northeastern Tanzania. Furthermore, rainfall during the April-May season was much below normal. This has resulted in degraded pastures and has reduced moisture for second season agriculture across the area. Showers are expected to develop across the area during the weekend. As a result, some improvement is expected in the short term moisture situation. The long term moisture situation will require more substantial rainfall over longer duration. 4. Seasonal rains during the 2002-03 rainy season were well below normal across northeastern South Africa, Swaziland and extreme southern Mozambique. Recent rains have increased moisture across much of the region, although October rainfall amounts were below normal. Widespread showers and thunderstorms should result in additional improvement, particularly in the eastern part of the region. Once the wet season rains have been established, the hydrologic drought will ease as ground water, rivers and reservoirs are recharged. 5. Meager precipitation in and around the land-locked kingdom of Lesotho negatively affected winter agriculture, reduced irrigation reserves and has reduced soil moisture for main season crop planting. Recent showers have increased top soil moisture. Additional rainfall during the period should improve moisture conditions for summer crop planting and ease the impacts of this past winter's drought. 6. A dry October has reduced soil moisture for summer crop planting across KwaZulu-Natal. Rainfall amounts for October 2003 were only 18 to 45% of normal across the province (40-80 mm below average). However, recent showers have eased moisture deficits, with additional rainfall on the way. As a result, conditions should continue to improve. - Climate Prediction Center & USGS Figure 1. Example of the CPC FEWS-NET Weekly Weather Hazards Assessment. Figure 2. Sample rainfall estimations from the Sahel to the Greater Horn regions in Africa from 4 August 2003 for the RFE v 2.0 (top), TRMM MPA-RT (middle), and CPC CMORPH (bottom). Figure 3. Mean difference of three daily rainfall estimates over Africa. The rain amounts (x-axis) represent the categorical amount of precipitation estimated by each product. 3. RESULTS To quantify the performance of the three algorithms, 1259 GTS stations over the African continent were selected for validation purposes. However, many of these stations are unreliable and incorrectly label missing values as zero rainfall, so it is necessary to only use stations that report daily rainfall. To resolve this quality control issue for this research, only stations that reported greater than 0 mm will be used in the comparisons. After each station was selected as having reported non-zero rainfall for the previous 24-hour period, the site is co-located by latitude and longitude to the nearest grid box of each rainfall estimate. In this point-to-grid box comparison, the stations are assumed to be “ground truth” for the rainfall product validation. Each of the three products were compared to the station data and daily biases are calculated. This type of comparison is necessary because unfortunately, it is nearly impossible to construct a precipitation analysis due to the unreliability and coarse spatial resolution of the gauge data (1 gauge per 23000 sq. km) and lack of other useful remote sensors such as ground-based radar. As the GTS station data are utilized as input data into the RFE algorithm, a slightly different approach is adopted to make the comparisons. The method used in this research drops a random 10% of the station data, while re-implementing the RFE algorithm. The station data thus removed are then used as an “independent” comparison to the product. This technique is repeated 10 times for each day, removing a unique 10% of the GTS data, to ensure that the entire African continent is represented in the comparisons. Figure 3 shows the mean bias (top) (GTS station data minus rainfall product estimations) and standard deviation of the mean difference (bottom). Both the RFE and MPA-RT products are compared from January through August 2003, while CMORPH product is included from April 2003 onward since it is relatively new and experienced several major upgrades prior to that time. The x-axis of both figures represents successive intervals in the amount of estimated rainfall by each product. This was done to better determine the performance of the algorithms across the range of estimated precipitation amounts. The preliminary results show similar findings and trends of the mean bias and standard deviation for the RFE, TRMM MPA-RT, and CPC CMORPH rainfall products over Africa. Since the RFE product is used as the primary rainfall estimate at CPC/FEWS-NET, the results have greater implications as the group expands and begins to focus on weather extremes on an international scale beyond the scope of the operational RFE product. Future work will include comparisons with independent data sets from individual African countries that are represented under the FEWS-NET program. Other work will be comprised of fine scale evaluations to verify the performance of these products over mountainous, tropical, and semi-arid regions of the continent. Additional products and work can be found at: http://www.cpc.ncep.noaa.gov/products/fews.html 1. INTRODUCTION In response to humanitarian needs in Africa, the US Agency for International Development (USAID) and the Famine Early Warning Systems Network (FEWS-NET) relies on NOAA/CPC to provide operational products such as rainfall estimates/anomalies, regional climate information, forecast model data, and the Africa Weather Hazards Assessment (see Figure 1). Since its inception in 1995, the CPC/FEWS-NET group has continually worked to develop and improve its products including the Rainfall Estimation algorithm to now be called RFE version 2.0, which was originally based on methodology as described in Xie and Arkin (1996) and has been enhanced, as noted in Herman et al. (1997). The RFE is used in conjunction with several rain gauge-based climatology products to resolve regions of drought and floods over the African continent and surrounding regions. To determine the validity of the RFE product, this poster will attempt to provide a description and preliminary comparison of the algorithm. Two other global precipitation methods; the NASA TRMM MPA-RT (Huffman et al. 2003) and CPC CMORPH (Joyce et al. in review), which are of similar spatial and temporal resolution scales, will also be used in the validation assessments. Both of these rainfall products along with the daily RFE estimation are compared to Global Telecommunication System (GTS) ground stations over Africa. 2.1 CPC RFE v 2.0 (Figure 2, top) • Algorithm inputs include: passive microwave (AMSU and SSM/I), geostationary infrared (Meteosat 5 & 7), and Global Telecommunication System ground precipitation measurements. • The 3-hour polar orbiting microwave measurements and half-hour geostationary infrared satellite precipitation estimates are combined using linear interpolation and merged with gridded rainfall gauge measurements using predetermined weighting functions to generate the RFE product (Xie 2001). • The RFE provides 24-hour rainfall accumulations on a horizontal scale of 0.1˚ x 0.1˚. The spatial extent of the product extends from 40˚S to 40˚N and from 20˚W to 55˚E. 2.2 NASA TRMM MPA-RT (Figure 2, middle) • Algorithm inputs include:TRMM Microwave Imager (TMI), SSM/I, AMSU, and AMSR, as well as infrared data from the global constellation of geosynchronous platforms: GOES, Meteosat, and GMS. • The microwave data sets are merged together and used to calibrate the infrared estimates. Then, the estimates are combined with the resulting infrared measurements such that it fills in gaps in the microwave coverage (Huffman et al. 2003). • The MPA-RT is a global (60˚N – 60˚S) product, which is produced on a 3-hour basis with a spatial resolution of 0.25˚ x 0.25˚. 2.3 CPC CMORPH (Figure 2, bottom) • Algorithm inputs include:microwave measurements from a variety of polar orbiting instruments (TMI, AMSU, and SSM/I) and geostationary platforms (GOES, Meteosat, and GMS). • The CMOPRH algorithm begins by determining the time sequence of feature motions maps from the infrared brightness temperature data, and then these maps are used to provide the displacement vectors for “morphing” from one instantaneous microwave estimate to the next (Joyce et al. in review). • The CMORPH product is produced globally from 60˚N – 60˚S on a latitude/longitude grid that provides an 8km scale at the equator. References Herman, A., V. B. Kumar, P. A. Arkin, and J. V. Kousky, 1997: Objectively determined 10-day African rainfall estimates created for Famine Early Warning Systems. Int. J. Remote Sensing, 18, 2147-2159. Huffman, G. J., R. F. Adler, E. F. Stocker, D. T. Bolvin, and E. J. Nelkin, 2003: Analysis of TRMM 3-hourly multi-satellite precipitation estimates computed in both real and post-real time. Preprints, Twelfth Conf. on Satellite Meteorology and Oceanography, Long Beach, CA, Amer. Meteor. Soc., 6 pp. Joyce, R. J., J. E. Janowiak, P. A. Arkin, and P. Xie, 2003: CMORPH: A method that produces global precipitation estimates from passive microwave and infrared data at 8km, ½ hourly resolution. J. Hydrometeor., submitted. Xie, P., 2001: CPC RFE version 2.0. NOAA/CPC Training Guide, Presented at the Drought Monitoring Centre, Nairobi, Kenya. —, and P. A. Arkin, 1996: Analysis of global monthly precipitation using gauge observations, satellite estimates, and numerical model prediction, J. Climate, 9, 840-858. * Corresponding author address Kevin B. Laws NOAA Science Center, 811D, 5200 Auth Rd Camp Springs, MD, 20746 email <kevin.laws@noaa.gov>


