Download
1 / 29
320 likes | 905 Views
Root Cause Analysis. Farrokh Alemi, Ph.D. Jee Vang. Definitions. Root cause analysis is a process for identifying the causes that underlie variation in performance, including the occurrence or possible occurrence of a sentinel event.

E N D
Root Cause Analysis Farrokh Alemi, Ph.D. Jee Vang
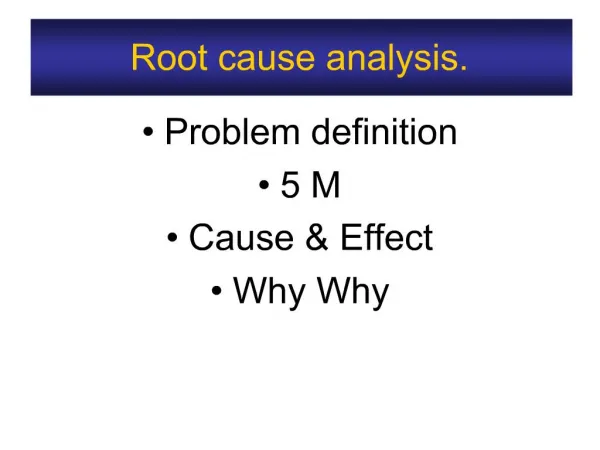
Definitions • Root cause analysis is a process for identifying the causes that underlie variation in performance, including the occurrence or possible occurrence of a sentinel event. • Sentinel event is a major adverse event that could have prevented (e.g. wrong side surgery)
Conducting Root Cause Analysis • Before a sentinel event occurs, an investigative team is organized. • When a sentinel event is reported, the people closest to the incidence are asked to record facts (not accusations) about the event. • The investigative team meets and brainstorms: • potential causes for the incidence • key constraints that if they were in place would have prevented the incidence. • Causes are organized into direct and root causes. • A flow chart is organized showing the direct causes linked to their effects • Analysis validated by checking assumptions and accuracy of predictions
Examples • Investigation of eye splash and needle-stick incidents from an HIV-positive donor on an intensive care unit using root cause analysis • The Veterans Affairs root cause analysis system in action. • Root cause analysis in perinatal care. • Root-cause analysis of an airway filter occlusion.
Definitions Continued • Bayesian networks transfer probability calculus into a Directed Acyclical Graph and vice versa. • A Directed Acyclical Graph is directed because each arc has a direction • The node at the end of the arrow is understood as the cause of the node at the head of the arrow. • It is acyclic because there is no path starting with any node and leading back to itself.
Links Between Graphs & Probabilities • Conditional independence implies a specific root cause graph & vice versa • Probability calculations are based on assumptions of conditional independence and vice versa ConditionalDependence Root CauseGraph Probability Calculus
Rootcause Directcause Sentinel event Conditional Independence in Serial Graph
Cause Weightgain Effect Effect High bloodpressure Diabetes Conditional Independence in Diverging Graph
Conditional Independence in Complex Graphs • Any two nodes with a direct connection are dependent • Any two nodes without a direct connection are independent if and only if: • Either serial or diverging • Not converging • If condition is removed, the directed link between root cause and sentinel event is lost • Assumptions of conditional independence can be verified by asking the expert or checking against objective data
Prediction from Root Causes • Use Bayes formula and Total Probability formula: • Use software: http://www.norsys.com/download.html • download free version at the bottom of the page • Download • Double click to self extract to directory Netica
Add nodes Click on this & click into white space
Add arcs Click onthis, click on start, click onend
Add Descriptions • Double click on a node • Enter description with no spaces
Add Marginal Probabilities • Double click on node • Select Table • Enter 100 times marginal probability, click for the “Missing probabilities” button for the system to calculate 1 minus marginal probability
Enter marginal probability of poor training as 12 standing for 12% Recalculates Remaining probabilities
Adding Conditional Probabilities • Double click on the node • Select table • Enter 100 times probability of effect given the cause • Enter data for each condition. When conditions change, probabilities cannot be calculated from previous data • Select the button for calculating remaining probabilities
Entering Probability of Not Following Markings Given Poor or Good Training Calculates remaining probabilities
Enter Conditional Probabilities for All Combined Direct Causes
Making Predictions • Select a node • Select the condition that is true • Read off probability of other nodes • Predict sentinel event from combination of root causes • Predict most likely cause from observed sentinel event • Estimate prevalence of root causes from observed direct causes
Predicting Prevalence of Fatigued Nurse if Patient is Marked Wrong
Discussion • Estimating the probabilities can verify if assumptions are reasonable, conclusions fit observed frequencies, and help select most likely cause. • JCAHO reports some conditional probabilities • Experts estimates are accurate if • brief training in conditional probabilities • Provided with available objective data • Allowed to discuss their different estimates
Take Home Lesson Question the obvious. Examine your root cause assumptions & predictions