Download
1 / 64
650 likes | 796 Views
INTERGLACIAL-GLACIAL VEGETATION DYNAMICS – A NATURAL LONG-TERM ECOLOGICAL LABORATORY. H. John B. Birks 1,2 & Katherine J. Willis 1,3 1 University of Bergen, 2 University College London, 3 University of Oxford. International Geological Congress, Oslo, 13 August 2008. Introduction Apologies

E N D
INTERGLACIAL-GLACIAL VEGETATION DYNAMICS – A NATURAL LONG-TERM ECOLOGICAL LABORATORY H. John B. Birks1,2 & Katherine J. Willis1,3 1University of Bergen, 2University College London, 3University of Oxford International Geological Congress, Oslo, 13 August 2008
Introduction Apologies Glacials and interglacials Why study interglacials? Interglacial vegetation dynamics General patterns Bioclimatic affinity groups Whole-assemblage approach Vegetation dynamics within interglacials Differences between interglacials Plant extinctions in interglacial-glacial cycles Lessons from interglacial-glacial long-term experiments Acknowledgements
INTRODUCTION Apologies • Kathy Willis • Change of title and abstract • Contains little new information but hopefully presents some new ways of thinking about interglacial and glacial vegetation dynamics as a natural long-term ecological laboratory • Limited geographical focus – primarily NW Europe, with brief excursions to the Balkans
Glacials and Interglacials The Quaternary period is the past 2.4 million years of Earth’s history. A time of very marked climatic and environmental changes with multiple glacial-interglacial cycles driven by variations in orbital insolation on Milankovitch time-scales of about 400, 100, 41, and 19-21 thousand year (kyr) intervals Glacial conditions account for up to 80% of the Quaternary Remaining 20% consist of shorter interglacial periods during which conditions were similar to, or warmer than, present day
Oxygen isotope fluctuations. Observations made from several deep sea cores (Modified from Shackleton et al. 1993 and Shackleton & Opdyke 1976) Climate and glacier fluctuations observed in deposits on the continent in Europe. Red: warm phases, blue: cold phases. Andersen 2000
Major climate forcing for the last 450 kyr calculated at 60N. Global ice volume (f) plotted as sea-level, so low values reflect high ice volumes. Jackson & Overpeck 2000
WHY STUDY INTERGLACIALS? • Primarily studied for stratigraphical purposes. Provide main basis for local and regional terrestrial Quaternary stratigraphies. Endless discussion and disagreements between Quaternary stratigraphies about correlations and interpretations, especially at a local geographical scale (e.g. East Anglia). • Shackleton & Opdyke (1973, 1976) V28-238, V28-239, etc. deep-sea cores. Multiple glacial-interglacial cycles in a complete sequence to Pliocene. ‘The Rosetta Stone of the Ice Ages’
Nick Shackleton, Phil Gibbard, and others in Cambridge, about 1974. Nick jokingly asked “Why bother with these local interglacial stratigraphies when we now have a complete global stratigraphy?” Nick suggested why not study terrestrial interglacials as ‘natural long-term ecological experiments?’ Interglacials are, after all, a series of unique natural long-term experiments in vegetation dynamics. This aspect of interglacials has been curiously ignored in long-term ecological studies and in ecological-based Quaternary vegetational history.
Using the palaeoecological record as a natural long-term ecological laboratory has been recently emphasised by the National Research Council’s (USA) report on The Geological Record of Ecological Dynamics – Understanding the Biotic Effects of Future Environmental Change Flessa & Jackson 2005
Three major research priorities emerge from this report: • Use the geological (= palaeoecological) record as a natural laboratory to explore biotic responses under a range of past conditions, thereby understanding the basic principles of biological organisation and behaviour. THE GEOLOGICAL RECORD AS AN ECOLOGICAL LABORATORY. ‘Coaxing history to conduct experiments’ Deevey (1969). • Use the geological record to improve our ability to predict the responses of biological systems to future environmental change. ECOLOGICAL RESPONSES TO ENVIRONMENTAL CHANGE. • Use the more recent geological record (e.g. mid and late Holocene and ‘Anthropocene’) to evaluate effects of anthropogenic and non-anthropogenic factors on variability and behaviour of biotic systems. ECOLOGICAL LEGACIES OF SOCIETAL ACTIVITIES. • Only 1 and 2 relevant here.
Despite Nick Shackleton and Neil Opdyke’s ‘Rosetta Stone of the Ice Ages’, problems remain in correlating terrestrial interglacial records with Marine Isotope Stages (MIS) of V28-239 and ODP 677. Coxon & Waldren 1997
INTERGLACIAL VEGETATION DYNAMICS General Patterns NW Europe – many inter-glacial pollen stratigraphies, e.g. East Anglia Hoxnian(=?Holsteinian) MIS 11c or 7c West 1980 Ipswichian(=Eemian) MIS 5c
Pastonian MIS? Cromerian MIS? Bramertonian MIS? Ludhamian, Thurnian, Baventian MIS? West 1980
All show four main phases • Pre-temperate phase – boreal trees (e.g. Betula, Pinus) • Early-temperate phase – deciduous trees (e.g. Ulmus, Quercus, Fraxinus, Corylus) • Late-temperate phase – mixed deciduous and coniferous trees (e.g. Carpinus, Abies, Picea) • Post-temperate phase – boreal trees (e.g. Betula, Pinus, Picea) and heathland development
Bioclimatic Affinity Groups • Can group pollen types into plant functional types or bioclimatic affinity groups (BAG) on basis of plant morphology, deciduous or evergreen, and modern climate affinities. • Three BAGs represent 70% of pollen assemblages at Velay, French Massif Central with 4 interglacials in one continuous record. Longest record in NW Europe. • Conifers • 2. Broad-leaved deciduous trees (mainly Quercus) • 3. Mesophilous temperate trees (mainly Fagus or Carpinus) • Rest are mainly herbs.
MIS 1 MIS 5e MIS 7c MIS 9c MIS 11c Dark green = Conifers Light green = Broad-leaved deciduous trees Blue = Herbs Orange = Mesophilous temperate trees Chedaddi et al. 2005
Dark green = Conifers Light green = Broad-leaved deciduous trees Orange = Mesophilous temperate trees Chedaddi et al. 2005
Correlation coefficients between interglacials Chedaddi et al. 2005 • MIS 9c, 7c, and 5e closely correlated. • MIS 1 and 11c less well correlated even though they have similar precessional variations. MIS 11c is closest climatic analogue to Holocene. • General similar vegetation dynamics in all five interglacials even though their durations were very different and their solar insolation values were different.
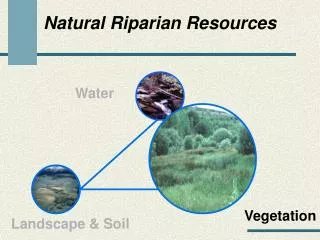
Whole Assemblage Approach Ioannina, Pindus Mountains, Greece Tzedakis & Bennett 1995 180 m sequence, Holocene + 4 interglacials
MIS 5e - climate different (solar insolation) - pollen different + pollen similar MIS 7c MIS 9c Different interglacials have different solar insolation values and different pollen stratigraphies, except for two interglacials with similar pollen stratigraphies. MIS 11c Tzedakis & Bennett 1995
Interglacial pollen stratigraphies, unsurprisingly, generally become more similar as one goes further north Lapland 5e 5e Denmark 7c or 11c 7c or 11c ? Some general patterns exist when considered ecologically Donner 1995
Vegetation Dynamics Within Interglacials (Eemian, Denmark) MIS 5e Erosion diatoms High lake productivity Telocratic Other nutrients Insoluble silicates + quartz Leaching Mesocratic Cumulative pollen curves and chemical composition for the interglacial deposit at Hollerup, Denmark Pediastrum algae LOI CaCO3 Protocratic LIGHT DEMANDING herbs, Betula, Pinus RICH MULL SOILS deciduous forest trees Lake sediment evidence MOR HUMUS/PEAT Picea, Sphagnum, Ericales Andersen 1966
LIGHT PLANTS Average percentages of the pollen of light-plants. Black columns indicate percentages and white = percentages x10 PROTOCRATIC PHASE Eemian IG (Inter-glacial) 5e Holstein IG 7c or 11c Harreskov IG ? Andersen 1969
MULL PLANTS Average percentages of the pollen of mull-plants and Alnus. Black columns indicate percentages and white = % x10 MESOCRATIC PHASE Eemian IG (Inter-glacial) 5e Holstein IG 7c or 11c Harreskov IG ? Andersen 1969
ACID HUMUS PLANTS Average percentages of the pollen of acid-humus plants. Black columns indicate percentages and white = percentages x10 OLIGOCRATIC AND TELOCRATIC PHASE Eemian IG (Inter-glacial) 5e Holstein IG 7c or 11c Harreskov IG ? Andersen 1969
Zone averages for light-demanding, brown-earth mull, and acid humus pants in four interglacials. Zones joined in order from bottom to top. Consistent patterns but different relative abundances between interglacials. Andersen 1994
+ Homo sapiens phase in Holocene Summary of Iversen’s (1958) glacial-postglacial (interglacial) cycle
What causes the change from the mesocratic with maximum forest cover and biomass and fertile soils to the oligocratic or telocratic phases with decreasing forest cover and biomass and less fertile soils? Need long (> 6000 year) ecological successions where one can study vegetation, soil, and ecosystem properties along chronosequences of sites of different but known ages. Wardle et al. 2004 Science 305: 509-513 Birks & Birks 2004 Science 305: 484-485
Dunes Islands Moraines Maximal phase Retrogressive phase Arjeplog, Sweden 6000 yr Glacier Bay, Alaska 14,000 yr Cooloola, Australia >600,000 yr Wardle et al. 2004
Lava flows Moraines Terraces Maximal phase Retrogressive phase Hawaii 4.1 x 10⁶ yr Franz Josef, New Zealand >22,000 yr Waitutu, New Zealand 600,000 yr Wardle et al. 2004
Tree basal area – unimodal or decreasing response with age Wardle et al. 2004
Measured C:N, C:P, and N:P ratios for humus and litter Significant increases in N:P and C:P ratios with age and forest retrogression Wardle et al. 2004
In the transition from the maximal forest biomass phase to the retrogressive phase, P becomes more limiting relative to N and P concentrations decline in the litter. N is biologically renewable but P is not, as P is leached and bound in weathered soils. Over time, P becomes depleted and less available, relative to N. Reduced rates of litter decomposition and release of P from litter and decreased activity of microbial decomposers. Proportion of fungi relative to bacteria increases. Fungal-based food webs retain nutrients better than bacterial-based food webs. Nutrient cycling thus becomes more closed and essential nutrients, especially P, become less available. Long-term decline in biomass is accompanied by increasing P limitation relative to N, reduced rates of P release from decomposing litter, and reductions in litter decomposition, microbial biomass, and ratio of bacterial to fungal biomass.
Tree biomass thus declines as P becomes increasingly limiting at onset of oligocratic phase. Birks & Birks 2004
Difference Between Interglacials Differences in relative abundance Corylus Picea +Abies 3/8 *Tsuga 3/8 Fagus 2/8 *Pterocarya 4/8 +Picea 6/8 *Not native in Europe +Not native in UK Taxon occurrences West 1980
These and other differences between interglacials may reflect biotic responses to • differences in climate in different interglacials (insolation, precipitation, CO2, etc) • differences in genetic variability of taxa between interglacials (e.g. Fagus, Corylus) • differences in biotic interactions in different interglacials (plant competitions, plant-animal interactions, etc) • differences in location of refugia between glacials • different probabilities of extinction after different interglacials or in glacials • different probabilities of external disturbance factors (fire, pathogens, etc) • interactions between some of all of these factors Embarrassingly ignorant of nearly all these potential drivers, especially when we consider interglacials
Different interglacials had different climates in terms of solar insolation values. Interglacial pollen stratigraphies are surprisingly broadly similar at the coarse plant functional or ecological group level but are, not surprisingly, different at the assemblage or individual taxon level. In general each interglacial begins with high summer and low winter insolation, then both summer and winter insolation reach present-day values, and finally summer temperature decreases and winter temperature increases. Main lesson from interglacials is the seemingly wide climatic tolerances of major tree taxa that dominate interglacials.
Virtually nothing is known about tree refugia prior to the Eemian (MIS 5e). As regards the Weichselian, knowledge of tree refugia in Last Glacial Maximum (LGM) is greatly changing, thanks to an increasing emphasis on plant macrofossil remains.
1. Trees in the LGM southern and Mediterranean refugia Interglacial LGM N S Traditional refugium model – narrow belt in southern mountains van der Hammen et al. 1971
LGM Tzedakis et al. 2002
Pollen and plant macrofossil evidence for traditional southern European LGM refugial model Pinus Quercus Fagus Ulmus Corylus Alnus Pistacia Tilia Betula Abies Bennett et al. 1991
2. What about trees in central, eastern, and northern Europe during the LGM? • Detection difficult • Low pollen values – do these result from long-distance pollen transport or from small, scattered but nearby populations? • Classic problem in pollen analysis since Hesselman’s question to Lennart von Post in 1916. No satisfactory answer. • Fewcontinuous sites of LGM age • Pollen productivity related to temperature and some trees cease producing pollen under cold conditions • Pollen productivity may also be reduced by low atmosphericCO2 concentrations • Other sources of fossil evidence critically important – macrofossils, macroscopic charcoal, and conifer stomata
Pol CzR Ukr Svk Aus Hun Rom Slo Cro Ser B&H Occurrences of macroscopic charcoal in central Europe CzR–Czech Republic; Aus–Austria; Slo–Slovenia; Cro–Croatia; Pol–Poland; Svk–Slovakia; Hun–Hungary; Ukr– Ukraine; Rom–Romania; Ser–Serbia; B&H–Bosnia & Herzegovina Willis & van Andel 2004
Tree taxa that have reliable macrofossil evidence for LGM presence in central, eastern, or northern European refugia Bhagwat & Willis 2008
Results from QUEST LGM plant macrofossil data-base for Eurasia, particularly former USSR for 25000-17000 cal yr BP Pinus – 25-17kyr cal BP Picea – 25-17kyr cal BP Larix - 25-17kyr cal BP Alnus - 25-17kyr cal BP (LGM ice and shorelines follow Peltier 2004) Binney et al. submitted Some trees (Picea, Larix) very close to ice-sheet margin as in eastern North America
Ice sheet Northerly LGM refugia Mediterranean LGM refugia 3. Current LGM refugium model based on all currently available fossil plant evidence Willis et al. 2008 (in press)
Temp Arcto-Tertiary flora PLANT EXTINCTIONS IN INTERGLACIAL-GLACIAL CYCLES Well known that the European flora, especially trees and shrubs, has become increasingly impoverished from Miocene to Holocene. 8 taxa van der Hammen et al. 1971 91 taxa