Download
1 / 40
400 likes | 545 Views
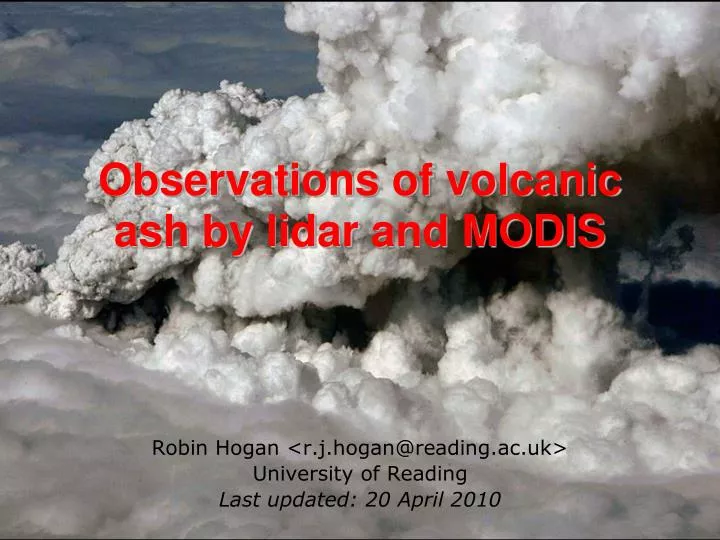
Observations of volcanic ash by lidar and MODIS. Robin Hogan <r.j.hogan@reading.ac.uk> University of Reading Last updated: 20 April 2010. Thursday 15 th , 1329. Summary from MODIS images Icelandic wind from northwest Further images: www.sat.dundee.ac.uk. Volcanic ash.

E N D
Observations of volcanic ash by lidar and MODIS Robin Hogan <r.j.hogan@reading.ac.uk> University of Reading Last updated: 20 April 2010
Thursday15th, 1329 Summary from MODIS images • Icelandic wind from northwest • Further images: www.sat.dundee.ac.uk Volcanic ash
Friday16th, 1234 • Volcano obscured by clouds Dilute volcanic ash measured over southern England and the Netherlands with lidar
Saturday17th, 1317 • Wind at Iceland from the north • Volcanic ash heading south behind a cold front Volcanic ash Cold front No depolarizing aerosol observed over Chilbolton or Cabauw
Sunday18th, 1222 Is this the ash above the cloud? • Northerly winds weakening Weakening front Not much sign in the MODIS image, but depolarizing aerosol observed at Chilbolton and Cabauw just above the boundary layer
Monday 19th, 1305 • New ash entering a low pressure system
16 April: 1044 UTC NASA MODIS radiometer
16 April: 1224 UTC Stationary colours in the sea (sediment and algae) Volcanic ash x Cabauw x Chilbolton NASA MODIS radiometer
Chilbolton Doppler lidar: 16 April Mixes into turbulent boundary layer Background aerosol particles in the boundary layer (0-1 km) Descending volcanic ash? Vertical velocity shows turbulence in boundary layer and also in ash layer
Chilbolton Doppler lidar: 16 April Spherical liquid droplets have very low depolarization Ash is non-spherical so strongly depolarizing Background aerosol particles in the boundary layer (0-1 km) Descending volcanic ash? Mixes into turbulent boundary layer
Aerosol optical depth: 16 April Aerosol optical depth at several wavelengths from the Chilbolton sun photometer, courtesy Charles Wrench of STFC Background aerosol particles in the boundary layer (0-1 km) Descending volcanic ash? Mixes into turbulent boundary layer
Chilbolton UV lidar: 16 April Background aerosol particles in the boundary layer (0-1 km) Descending volcanic ash? Ash is non-spherical so strongly depolarizing Spherical hydrated aerosol with minimal depolarization Mixes into turbulent boundary layer
Chilboltonlidarceilometer: 16 April • Chilbolton has three routinely operating lidars • 1500 micron Doppler/polarization lidar (previous slides) • 905 nm lidar ceilometer • 355 nm (UV) polarization lidar (previous slide) • Can use the wavelength dependence of the scattering to estimate particle size • The following slides are from Ewan O’Connor and Chris Westbrook, University of Reading...
Colour ratios for each combination Less than 1 Note contrast with ordinary boundary layer aerosol Close to 1 Greater than 1
Colour ratios: 355/905 Less than 1 Note contrast with ordinary boundary layer aerosol Calculations for different possible refractive indices: median diameter greater than 800 microns
Colour ratios: 905/1500 Greater than 1 Note contrast with ordinary boundary layer aerosol Upper bound ~2 microns assuming not liquid water Calculations for different possible refractive indices: median diameter greater than 800 microns
Colour ratios Suggests median diameter is between 0.8 mm and 2m Further analysis will narrow this down… Less than 1 Note contrast with ordinary boundary layer aerosol Close to 1 Upper bound ~2 microns assuming not liquid water Calculations for different possible refractive indices: median diameter greater than 800 microns Greater than 1
Just using two colours: 355/1500 nm Assumed ash refractive index 1.5 – 0.001i: volcanic ash is 1.7-2 microns in diameter (similar result for more absorbing ash)
Sun photometer derived size distribution • Courtesy of Charles Wrench, STFC • Large-particle mode peaks at 3 microns radius: in good agreement with lidar-derived values
Surface sulphur dioxidehttp://www.airquality.co.uk/ Mixing event at Chilbolton: 15.00, 16th Apr • Are the spikes due to volcanic ash? • Timing is good over London but a bit late at other locations • In fact, the Met Office Unified and NAME models can both reproduce this spike WITHOUT volcanic ash, implying that this is an ordinary boundary layer pollution episode! • The amounts are much less that UK air quality objective (1 hr average exceeds 350 mg m-3 less than 24 times per year)
Aerosol particles (PM10s) No convincing sign of ash
Ultraviolet EZ-lidar, Cardington Bedfordshire, 16th April • http://www.metoffice.gov.uk/corporate/pressoffice/2010/volcano/lidar/ • This plot was produced by the University of Manchester, NCAS and FGAM.
RIVM Caeli lidar, Netherlands, 16th AprilCourtesy of Arnoud Apituley <Arnoud.Apituley@rivm.nl> • This lidar is not operated all the time but has Raman capability • Further images here: http://cerberus.rivm.nl/lidar/Cabauw/2010/ Volcanic ash just above boundary-layer
Cabauw EZ-lidar, Netherlands, 16th AprilCourtesy of David Donovan, KNMI <donovan@knmi.nl> Ash appears not to mix into the boundary layer as it did over Chilbolton… As over Chilbolton, ash much more depolarizing than ordinary boundary-layer aerosol
Ash higher at leading (southern) edge, explaining the descending appearance to ground-based lidar Volcanic ash? Boundary-layer clouds Calipso swath Simultaneous MODIS image
Chilbolton Doppler lidar: 17 April Normal aerosol particles in the boundary layer: no further sign of volcanic ash… • Further images at http://www.met.reading.ac.uk/radar/realtime/today.html
Chilbolton UV lidar, 17 April Normal aerosol particles in the boundary layer: no further sign of volcanic ash…
Chilbolton Doppler lidar: 18 April Is this volcanic ash? Doppler lidar shows that it sits above the turbulent boundary-layer in the morning, which is why it is not immediately entrained into the boundary layer
Chilbolton UV lidar: 18th April Depolarization implies it is volcanic ash Aerosol optical depth at several wavelengths from the Chilbolton sun photometer, courtesy Charles Wrench of STFC Entrained into and diluted by existing boundary-layer aerosol when boundary layer grows?
Cabauw EZ-lidar, Netherlands, 18th AprilCourtesy of David Donovan, KNMI <donovan@knmi.nl> Similar signature observed by UV lidar at Cabauw De Bilt radiosonde put midday boundary-layer top at ~1 km
Cabauw EZ-lidar, Netherlands, 18th AprilCourtesy of David Donovan, KNMI <donovan@knmi.nl> Another layer coming in? • Further images: http://www.knmi.nl/~knap/lidar_cabauw/
Chilbolton Doppler lidar, 19th April Deeper more dilute layer of volcanic ash above the boundary layer?
Chilbolton UV lidar, 19th April Deeper more dilute layer of volcanic ash above the boundary layer? Weaker depolarizing signature