Download
1 / 22
250 likes | 276 Views
Efficient Software Test Case Generation Using genetic Algorithm Based Graph Theory. By: Dr. Velur Rajappa Arun Birabar Satanik panda. ABSTRACT.

E N D
Efficient Software Test Case Generation Using genetic Algorithm Based Graph Theory By: Dr. Velur Rajappa Arun Birabar Satanik panda
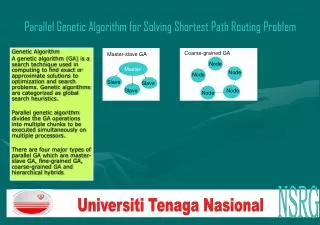
ABSTRACT • In this the new and efficient test case is generated using Graph theory based Genetic algorithm other than using modeling based testing approach for generating test cases for software testing, for the generation of the test cases first the directed graph is created with all the intermediate states. In this cross over operation is performed and this genetic testing method is mostly used in network testing and system testing. This testing works as an alternative testing where modeling based testing does not produce the expected output.
THE NEED OF TEST CASES FOR SOFTWARE ENGINEERING Software testing is an essential part of software development which guaranteed the validation and verification process of the software. In order to do so we must have to adopt the process of mapping the software for all its transition states and individually validating the output for a set of given input. For a given part of software we will be writing a set of test cases called test suites. In order to find out how a test case is valid we do not have definite mechanism. We basically depend on the testers understanding of the requirement. In this Process we have lot of human error and his basic skill level taken into consideration. This leads to the inclusion of bugs in the system after testing also. To over come this there are many approach already being taken and getting implemented. Hence we propose the genetic graph based approach to find a better solution of the issue.
INTRODUCTION TO GRAPH THEORY The graph theory approach will be needed for the implementation of all the graphs to representation of the states of the system. We will implement the total system state as directed graph. A simple graph, denoted G = (V,E), consists of a set Of vertices, V, and a set of edges, E, where the edges are lines that Connect pairs of vertices's.Figure 1 (a), (b), (c), and (d) show examples of graphs.
GENETIC ALGORITHMS The method we are going to use when it comes to searching for a counter example is Genetic Algorithms (GA). Genetic algorithms are best defined as a pollution based search algorithm based loosely on concepts from biologic evolution. Since the key data structure used in Genetic Algorithms is bit strings, we must have a way to represent a graph as a bit string. The Sections includes: -Representation -Tournament -Initialization -Recombination -Crossover operation -Replacement -Mutation -Repeat -Evaluation of fitness Representation of a graph as a Bit String
INITIALIZATION The next step is to select a random sample of Individuals from the search space. In this case, the search space is all the different graphs of size 43 (approximately 6.76 x 10271). From this, a sample of 250 individuals was selected. The random samples are independent from run to run.
CROSSOVER OPERATION In the crossover operation, two solutions are sexually combined to form two new solutions or offspring. The parents are chosen from The population by a function of the fitness of the solutions. Three methods exist for selecting the solutions for the crossover operation. The first method uses probability based on the fitness of the solution. If is the fitness of the solution Si and is the total sum of all the members of the population, then the probability that the solution Si will be copied to the next generation is:
MUTATION Mutation is another important feature of genetic programming. Two types of mutations are possible. In the first kind a function can only replace a function or a terminal can only replace a terminal. In the second kind an entire sub tree can replace another sub tree.
EVALUATION OF FITNESS Now that we have 250 individuals, we must conduct tournaments to see which graphs are better than others. In order to conduct the tournaments, we must have a way of ranking or ordering the individuals. This is called the fitness function. Upon creation of our fitness function, examination of current maximum clique algorithms and approximation algorithms was very helpful. In our case, the fitness of an individual is the number of cliques of size 5 in the graph plus the number of independent sets of size 5 in the graph. This was chosen because of the direct application to the problem. The possible fitness values for an individual from this fitness function range from 0 to 962598 (taken from K43). A graph with fitness value of 0 would have no cliques of size 5 and no Independent sets of size 5 and thus would be the desired counterexample.
TOURNAMENT Now that each individual has a fitness value, tournaments can be conducted in order to rank our population. Using a tournament size of 2, individuals compete for chances to produce offspring. In our case, 2 individuals are chosen at random from the population. These two individual’s fitness values are compared and the one with the better (i.e. smaller) fitness value is chosen to be a parent. This can be related to the “survival of the fittest” idea in biology.
RECOMBINATION The better individuals are now chosen to produce offspring Through point mutation and one-point crossover. We chose to have a 50% Mutation rate, meaning that mutation takes place at approximately the same frequency as one point crossover. Point mutation involves randomly choosing one of our 903 bits in our bit string and flipping it, i.e. making it a 0 if it was a 1 and vice versa. This translates to the removal or addition of an edge to the graph, thus creating a new graph. Mutation Recombination Technique Contd..
RECOMBINATION One-point crossover involves taking two individuals and merging them together. To do this, a random point, n, must be chosen such that the new individual consists of bits 0 to n-1 from the first parent and bits n to 902 from the second parent. One-point Crossover Recombination Technique
REPLACEMENT Now that new offspring are created, they replace the poorer individuals in the population as was decided by the tournaments. In the standard replacement, all of the new offspring are replaced at the same time at the end of one generation. In our case, however, we are using a steady state system with 25% replacement. This means that one individual is replaced every time a tournament completes. After 25% of the population (63individuals) is replaced, one generation is complete.
REPEAT Evaluation of Fitness, Tournament, Recombination, and Replacement are repeated for as many generations as is chosen by the user. In our case 400 generations was chosen because after about 400 generations there was little improvement in the best fitness. This is due to the decreased variation in the population, meaning that all of the individuals began to look the same or Strikingly similar. GA Life Cycle
OUR APPROACH We propose the solution to be a combination of graph theory and genetic algorithm. At first we will draw the general graph of all the states of the software. To fulfill the total state of the system we can use finite automata and Turing machine. Once the graph is ready we will give the flow direction on every edge. Then the newly Built directed graph will be taken from generating the dual graph pairs to find the test cases from it. Each dual pair will be taken for the gene for the input of genetic algorithm. In this process we will be generating a set of chromosome, which will produce the test suite.
THE STEPS TO BE FOLLOWED We will get a model of the system for all its probable states and that will represent as a dual graph in the following manner. 1. Create a dual graph of the original graph (i.e., a graph in which the arcs of the original graph are converted to nodes). 2. Everywhere in the original graph that arc 1 is an incoming to a node and arc 2 is outgoing from the same node, create an arc in the dual graph from node 1 to node 2. For instance, in the left hand graph in, arc “a” is incoming to the node from which arc “b” is outgoing; therefore in the dual graph (on the right hand side of Figure 6), there is an arc from node “a” to node “b”. 3. Right Figure shows the completed dual graph. 4. Eulerize the dual graph (by duplicating arcs to balance node polarities) 5. Traverse the Eulerized graph, noting the names of the nodes that you pass. Contd. . .
Dual Graph generation The generated sequence will be the length 2-switch covers for the graph. (You can see that all 2-link combinations, including “b c”, “b f” and “b g” are generated.) a b c b f e c b g d e f e g Contd. . .
Dual Graph generation Next step is to convert this sequence into genetic population by encoding the duals in 0 and 1 format. For this purpose we have to create a matrix of the order of the number of dual found in the generated graph. On that population we have used the mutation and cross over operation to find the child as a pair of new link. The operation has been repeated till we covered the whole graph at least once. From the out put we have produced the test cases which belongs to only one test suit for the given system under study.
CONCLUSION In this way if we find the state optimal system then The probability of the untested paths for a given system behavior will be minimized and the test coverage will be significantly increase.
REFERENCES • D.E.Goldberg, Genetic Algorithms in Search, Optimization,and Machine Learning, Addison-Wesley, 1989. 2. Beizer, B. (1990) Software Testing Techniques, 2nd Edition. 3. Gross, J. and Yellen, J. (1998) Graph Theory and its Applications. 4. Murthy, C. and B. Manoj. 2004. Ad hoc wireless networks architectures and protocols. Prentice Hall, Upper Saddle River, New Jersey. 5. Rappaport, T. 1996. Wireless communications: principles and practice. Prentice Hall, Upper Saddle River, New Jersey. 6. Stine, J and G. Veciana. 2004. A paradigm for quality-of service in wireless ad hoc networks using synchronous signaling and node states. IEEE Journal on Selected Areasin Communication. 22 (7): 1301-1321. 7. Andrew S. Tanenbaum, Computer Networks. Fourth Edition, PrenticeHall. 8. Rex Black. Critical Testing Processes: Plan, Prepare, Perform, Perfect 9. Elfriede Dustin. Effective Software Testing: 50 Specific Ways to Improve Your Testing. 10. K. Thulasiraman and M.N.S. Swamy. Graphs: Theory and Algorithms. John Wiley & Sons 1992.
THANK YOU ANY QUESTIONS ?