Download
1 / 17
200 likes | 534 Views
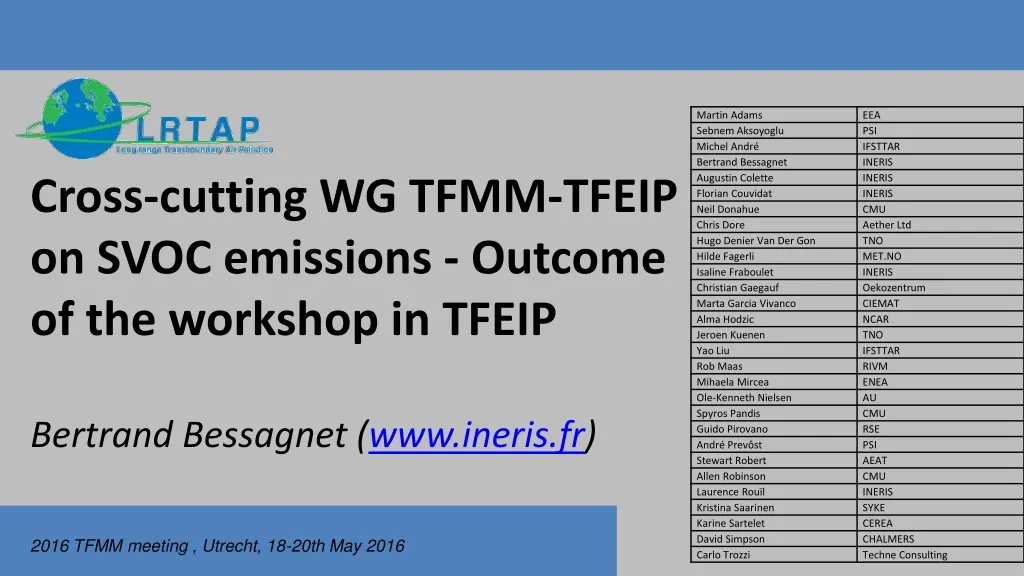
Cross- cutting WG TFMM-TFEIP on SVOC emissions - Outcome of the workshop in TFEIP Bertrand Bessagnet ( www.ineris.fr ). Why this working group?.

E N D
Cross-cutting WG TFMM-TFEIP on SVOC emissions - Outcome of the workshop in TFEIP Bertrand Bessagnet (www.ineris.fr)
Whythisworking group? • Organic matter (OM) represents 20 to 30% of the particulate matter in Europe, this fraction is dominated by the secondary organic fraction produced by chemical reactions of organic precursors (Freutel et al., 2013, Crippa et al., 2013) • Official primary PM emissions decrease (e. g. use of filtering techniques for the case of diesel vehicles, improvement of efficiency of wood stoves, etc…) • Air quality models usually underestimate PM, and the lack of some emissions is considered as one of the explanations (particularly in winter due to wood burning) • The secondary fraction and/or the organic fraction are underestimated by models • In smog chambers, the aging of diesel vs gasoline exhausts show the importance of SOA formation. In some experiments, gasoline vehicles produce more aerosols than diesel vehicles after several hours in the chambers → role of VOC and S/IVOC • WG on emissions decided during the 2015 TFMM in Krakow • Semi volatile Organic Compounds (SVOC) are partly included in emission inventories • How to complement these emissions inventories?
Concept of SVOC - I • All organic species are more or less volatile and can be considered as semi-volatile, their vapour pressure is the key parameter to define the volatility. • The temperature and the organic aerosol loading (the total mass of organic species into which semi-volatile species can condense) influence the partitioning between the gas and particle phases. • VOCs represent the most volatile fraction of organic species. • The heaviest organic molecules (in term of molecular weight) can be considered to be entirely in the particulate phase, they constitute what is commonly called organic matter. • In between, there is a large spectrum of molecules that are partitioned between the gas and particle phases, they are called in a broad sense SVOC (semi-volatile organic compounds).
Concept of SVOC - II • Organic species can be split in: • ELVOC (Extremely low Volatile Organic Compounds) • LVOC (Low Volatile Organic Compounds) • SVOC (Semi Volatile Organic Compounds) • IVOC (Intermediate Volatility Organic Compounds) • VOC (Volatile Organic Compounds) • These categories can be delimited by vapour pressure thresholds • This delimitation is arbitrary, the Gas/Particle partitioning can change with the temperature and the level of concentrations • Chemistry transport models host secondary organic aerosol modules able to produce secondary organic aerosol from gas phase organic species POA (PrimaryOrganicAerosol) in gas and particle phases SVOC in a broadsense
Evolution of SVOCs • Air quality models have chemistry modules to account for the VOC and SVOC chemistry • Some simple considerations: • Dilution of SVOC leads to evaporation • Decrease of T° leads to condensation/absorption of SVOC • Oxidation reactions lead to the formation of bigger molecules
Untilnow, how do modellers manage SVOC emissions? • So far, emission inventories are targeted on VOC, NOx, SOx, NH3, CO and PM broken down into PM2.5 and PM10 • A speciation is often proposed to identify the organic matter in each PM fraction • EC / OM / Other • OM is organic matter supposed as particulate matter at the emission • “other” means non carbonaceous species (dust, inorganics, etc…) • Modellers do their own calculation of total primary organic matter (gas + particles) emitted by a given sector with coefficients based on dilution curves reported in the literature. • TPOM= 2 * OA (as an example) • IVOC canbeconsidered as not included in TPOM then IVOC isestimatedfrom TPOM or VOC emissionfactors (Ots et al., 2016)
Dilution curves - a tool to estimate total POA • AtCoa=10 µg/m3 and 25°C, about 55% is in the particle phase • If youmeasuresolid POA, you have to multiply 1/0.55~2 to get the total organic fraction (Gas+Particles) • If wecouldmeasurehigherCoawecouldtakeintoaccountmissing SVOC (the socalled IVOC) Dilution curve from 51 light-duty American gasoline vehicles (from May et al. 2013a) at 47°C and 25°C. 55%
PM EF measurements – focus on the organic fraction IVOC SVOC LVOC ELVOC Ambient POA + POA in dilution samplers + + Total SVOC without IVOC 14 IVOC 12 10 Not adsorbed on filters 8 Emission Factor in mg km-1 Adsorbedvapors on filters 6 Inorganics 4 Metals-dust 2 ElementalCarbon VOC 12 16 20 24 28 32 36 MoleculeCarbonnumber Adaptedfrom Robinson et al. (2010)
How muchorganics in EF? • For a good assessmentweneed to identify + + + • The coefficients used for this estimation are based on very few publications (dilution curves) and sometimesold coefficients • Wedon’t have any clues about the operating conditions (T° and PM load) of the EF measurements In the dilution sampler ? SVOC PM Inorganics Dust ElementalCarbon
How to proceed to identify SVOC/IVOC in emissions for a better air pollution assessment ?
Two options for the future (10 years) • OPTION I • An updated (=increased) PM emission estimate including SVOC will be determined with (by activity sector), integrated with: • A split by components : OM, EC, other (minimum requirement) • A split by volatility for OM (including SVOC), for each of volatility classes a split by species will be provided • An updated (=increased) total VOC estimate including IVOC will be determined, integrated with • Improvement of the VOC split including also IVOC Impact: Automatically, increase the total emissions by country
Two options for the future (10 years) • OPTION II • PM without OM should be known • OM including SVOC will be determined separately • A split by volatility for OM (including SVOC), for each of volatility class a split by species will be provided • VOC • Improvement of the VOC split • IVOC will be determined separately with a split by species
Someoutcomes of the workshop I • TFEIP knows better our needs in terms of semi volatile compounds and why, and the community is evolving to methods including “condensables” • “Condensable” vs “Semi Volatile Organic Compounds” • Condensables include inorganic species too : • Comparable orders of magnitude for nitrate /ammonium and organic compounds • For high fuel contents (shipping) sulfate can dominate the “condensable” fraction • We wonder if “condensable” is the right word perhaps “condensed “ is more appropriated, then we would miss the gas fraction that modellers need. • The guidebook of EF has been reviewed with an information on the type of particles taken into account : filterable PM or total (means including condensables)
Someoutcomes of the workshop II • Presentation by Jeroen (TNO) of the impact of the new approach to account for condensable (+ an update of activities) in Emission Inventories (Denier van derGon, 2015) • David (EMEP) presented some basics of SOA modelling with EMEP and how they handle POA emissions (No adjustment coefficientfor modelling in the frame of the Convention)
Someoutcomes of the workshop III • A suggestion for EI was made to get all the organic matter from VOC to ELVOC in one species OM (+ volatility split and screening by species) • We (modellers) suspect the “condensable” fraction of organics is not exactly what we need in models: • IVOC are not included • Gas phase fraction of SVOC molecules could be also not included • INERIS has proposed for France a pilot study for the road traffic sector consisting in: • Calculating total PM emissions by subsectors for FR (ex. EURO5 diesel emission PC , etc…) • Identify corresponding EF for each subsector (COPERT used in FR) • Interactions with COPERT team (AUTH) to understand how the EF are determined and under which operating conditions and if they account for all organics species • Develop a method based on AUTH expertise or dilution curves to complete our needs for modelling • If relevant, we could repeat this exercise in other countries
Dilution curves – application with french data for vehicleemissions • What are the level of PM concentrations and temperatures in the CVS sampling system: • Diesel vehicle (without Particulate filter) : 1.102 - 6.103 µg/m3 • Petrol or Diesel vehicle (with Particulate filter) : 4.101 - 1.5.103 µg/m3 • Temperature : 36°C • Determination of Xp: • Diesel vehicle (without Particulate filter) : 70-95% • Petrol or Diesel vehicle (with Particulate filter) : 50-90% Total POA (including all SVOC) couldbe 2 times thatismeasured May et al, 2013