Download
1 / 32
320 likes | 461 Views
Study of timing performance of Silicon Photomultiplier and application for a Cherenkov detector. G. Ahmed, P. Bühler, J. Marton, K. Suzuki. Stefan Meyer Institute for Subatomic Physics, Vienna. G. Ahmed, 12th -VCI 2010 18.Feb, 2010. Outline.

E N D
Studyof timing performance of Silicon Photomultiplier and application for a Cherenkov detector G. Ahmed, P. Bühler, J. Marton, K. Suzuki StefanMeyerInstitutefor Subatomic Physics, Vienna G. Ahmed, 12th -VCI 2010 18.Feb, 2010
Outline • Motivation. • SiPMtiming performance. • Cherenkov counter prototype. • Beam test and results. • Summary & conclusion. 12th -VCI 2010 18.Feb, 2010
Motivation • Start detector working in a magnetic fieldwith • time resolution in the range of 100 ps is highly • required, this motivated us to think about using • SiPM for this purpose. • Readout of promptly emitted Cherenkov light with SiPM is a promising combination, the idea is to benefit from the promptly emitted light to study the performance of the Cherenkov counter prototype based on the SiPM readout. • If such a counter works and demonstrates a sufficient timing performance, it could be a valuable alternative for a beam line TOF-start counter, due to the advantages like cheapness, compactness, magnetic field resistance and simple operation. 3 3 12th -VCI 2010 18.Feb, 2010
SMI activities • Test different types of SiPM • (MAPD-Zecotek, SiPM-Photonique, MPPC-Hamamatsu, ….) 3.5 GHz, 40GS/s. CAMAC system. Water Cooling system. Hamamatsu MPPC, Zecotek MAPD different sizes Dark box, Keithley 617 programmable electrometer, Pico second laser system 4 12th -VCI 2010 18.Feb, 2010
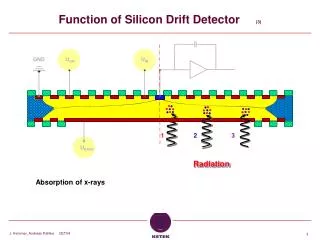
Breakdown Voltage Dark current vs Bias Voltage • Breakdown Voltage (S10362-33-100C) (S10362-33-100C) 1 p.e. Pedestal Excellent single photoelectron resolution 2 p.e. 3 p.e. 4 p.e. 5 p.e. 6 p.e. (S10362-33-100C) d • SiPM parameter measurements Gain vs Bias Voltage Hamamatsu (S10362-33-100C) 5 12th -VCI 2010 18.Feb, 2010
(1) (2) (3) Beam profile monitor SiPMs in combination with a 16×16 scintillating fiber grid in 2 planes were used for a beam profile monitor for the FOPI experiment (1). Beam profile monitor mounted at FOPI/GSI (2). Proton beam profile measured in x-and y-axis (3).
Discriminator Splitter Al Case QDC SiPM Start signal SiPM signal Gate generator TDC Laser trigger signal Laser 10 n F 50 mv/div 1 k Ohm Stop signal 50 ns/div 1 k Ohm 10 n F SiPM time resolution measurements Time resolution was studied by illuminating SiPM with blue laser light pulsewidth 32 psat wave length 408nm. Signal Variablelight attenuator 10 n F 10 n F 10 n F 1 k Ohm 1 k Ohm 1 k Ohm 1 k Ohm 1 k Ohm 1 k Ohm 10 n F (700 ps) Photonique preamplifier (AMP-0611) 12th -VCI 2010 18.Feb, 2010
(TDC/QDC) before correction σ= 315 ps σ= 246 ps (TDC/QDC) after correction Time resolution measurements Time resolution was calculated after slewing time corrections as sigma (σ) value by Gaussian fitting for TDC distribution. MPPC 9 mm2, 67.1V, -12C 8
Time resolution measurements MPPC (1, 3 mm2) Hamamatsu. MAPD-3N, Zecotek. • Time resolution improves with increasing the number of photons and/or operating voltage. 9 12th -VCI 2010 18.Feb, 2010
Cherenkov counter prototype • A radiator made of quartz, 1 cm thick and 5 cm long, optically coupled on both sides to 3×3 mm2 MPPCs(S10362-33-100C) Hamamatsu, this devices was primarily selected because of its large active area. • The other series (S10362-11) has potentially better intrinsic timing performance, however due to the smaller sensitive area (1mm2), the reduction of photon collection will have a negative impact on the overall timing performance. 10 12th -VCI 2010 18.Feb, 2010
Photograph of the prototype Cherenkov counter Preamplifier MPPC Radiator Cherenkov counter prototype • In order to reduce the losses due to imperfect reflection the radiator is wrapped with an aluminum foil and covered with light- tight black tape. MPPC signals are amplified with fast preamp, AMP_0611, while attached directly to the preamp board to minimize electronic noise pick-up. 12th -VCI 2010 18.Feb, 2010
Cherenkov counter prototype • We estimate ~20 detectable photo-electrons on each photosensor due to radiator interaction with 500 MeV electron beam, considering light losses due to transmission, absorption and photosensor efficiency. • Based on the number of photons, the expected time resolution is ~200 ps, according to our previous laboratory measurements. • For a comparison, scintillating fiber gives ~20 photons/1 mm2 but presumably photon is generated “slowly” (~2 ns) compared to the Cherenkov process (~30 ps). It’s interesting to see if the SiPM can exploit that. 12th -VCI 2010 18.Feb, 2010
The Beam Test Facility (BTF) • The DAFNE Beam Test Facility (BTF) initially optimized to produce single electrons and positrons in 25 – 750 MeV energy. • Beam line was tuned to maximize single-particle • events with repetition rate 50 Hz with a maximum • particle flux of 1 kHz, so that the maximum • multiplicity is 20 particles per pulse. • BTF magnets were set to select e+/− with energy of ~ 490 MeV. Layout of the BTF transfer line and its main components. 13 12th -VCI 2010 18.Feb, 2010
Test at the BTF • The beam diagnostics elements at BTF include a Pb-glass calorimeter. The beam particles are totally absorbed in the calorimeter so that the integrated signal from detector provides a measure of the beam particle multiplicity. • The separate peaks correspond to beam pulses of 1, 2, 3, and more beam particles. This information allows to select beam pulses of a specific multiplicity by software in later analysis. • Calotypical energyspectrum of BTF beam at low multiplicity was acquired with charge ADC. 12th -VCI 2010 18.Feb, 2010
Detector setup Four detectors were installed for the measurements. T1 & T2 are the reference counters for the TOF measurements, consist of scintillators (BC-408: 2, 1 cm) and read out on both ends by PMTs (Hama- H8409-70). The Cherenkov counter C1 is placed between T2 and the Calo. Data taking was triggered by a coincidence between T1, T2 and extraction signal provided by the accelerator. 15 12th -VCI 2010 18.Feb, 2010
Detector setup (BTF-hall) Bias connectors Analoge signal out. Cherenkov Counter Al box Start counter (T1) Start counter (T1) Start counter (T1) (e-/+) beam direction Cherenkov Counter (C1) Calorimeter (Calo) Vacuum valve Vacuum valve Water cooling sys, Bias voltage sys, temp. controller • Test at the BTF • For testing the Cherenkov counter is mounted in a light and vacuum tight aluminum box, SiPMs are thermally coupled to water-cooled peltier elements, which allows to regulate the temperature of the device down to approximately −20◦C. • In order to avoid condensation the box is evacuated to a pressure of ≈ 10−3 mbar.
Readout electronics The readout electronics was set up to measure charge spectra and TOF between the reference and Cherenkov counters. Each counter signal output was split into two lines. One was connected to a QDC for the charge measurement. The other line was fed into a leading edge discriminator and the outputs were fed into a TDC for the time measurements, and were also used to produce a gate signal for the QDC and a common start signal for the TDC. 17
Beam test and results • All the QDC and TDC signals were recorded to PC via CAMAC PCI bus interface and stored for offline analysis. • Figure shows Cherenkov counter recorded charge spectra for each MPPC side, while black and blue lines represent the charge distributions measured while beam-on and beam-off conditions. • In response to the penetrating particles, each MPPC sensor was able to detect an average number of 8 photons. 18
Beam test and results TOF(T1-T2) = 130 ps. T1 and T2 performance good enough ( ~100 ps) to evaluate C1. Cherenkov counter time resolution is 350 ±100 ps. The result not overwhelming but in agreement . Accuracy of the measurements was limited by the low statistics. • For data analysis, we selected only single particle (e+/−) events using the calorimeter energy spectrum. • We measured TOFs between the three possible pairs of counters T1, T2 and C1 in order to disentangle intrinsic timing resolution for each counter. σ = 360 ps σ =365 ps σ = 130 ps • Time difference between T2 and TC • Time difference between T1 and TC • Time difference between T1 and T2 19
Summary • Cherenkov counter was able to detect 8 photons in comparison with ~20 photons expected. • The achieved time resolution is 350 ± 100 ps in comparison with 280 ps measured in the lab. • The detected photons are lower than the expected, however the achieved time resolution is in an agreement with the expectation at the given number of photons. • Signal rise time turned out to be slow. • AMP_0611 has 2-3 ns risetime depending on the input pulse height, instead of what is claimed (700 ps). • Risetime measurement of raw SiPM output on the way. 12th -VCI 2010 18.Feb, 2010
Conclusion We are evaluating SiPM in terms of timing measurement. According to our measurement time resolution is not great, though there’s inconsistency with Hamamatsu catalog. Simple Cherenkov counter with SiPM was constructed and tested using e+/− beam. The aim was to make a proof of principle and to obtain a first measure of the timing resolution of this device with a TOF measurement in a real accelerator environment. Sub-nanosecond (~350 ps ) time resolution has been achieved. Current limitation seems to come from the detector performance itself, though there is a room for improvement (preamp, more carefully designed radiator and light guide). 21 12th -VCI 2010 18.Feb, 2010
Thank You for your attention ! 22 12th -VCI 2010 18.Feb, 2010
Cherenkov Radiation. The angle θc of Cherenkov radiation, relative to the particle’s direction, for a particle with velocity βc in a medium with index of refraction n is The number of photons produced per unit path length of a particle with charge ze and per unit energy interval of the photons is
Calculate the number of emitted Cherenkov radiation if electrons with energy 489 MeV bathing throw 1 cm quartz glass of refractive index (n = 1.46). According to the relativistic dynamics,
TOF • Ti = (TiLeft + TiRight)/2 average mean time for each detectors. • TOF (Tc, T1) = TT1– TC. • The intrinsic timing resolution of each counter is obtained by solving three linear equations of the TOF resolutions among three counters, the Tc, the T1 and the T2 s2TOF (TC, T1) = s2TC + s2TT1 s2TOF(TC, T2) = s2TC + s2TT2 s2TOF(T1, T2) = s2TT2 + s2TT1 sTC = sTT1= sTT2=
All the QDC and TDC signals were recorded to PC via CAMAC PCI bus interface and stored for offline analysis. Figure shows Cherenkov counter recorded charge spectra for each MPPC side, while black and blue lines represent the charge distributions measured while beam-on and beam-off conditions. In response to the penetrating particles, each MPPC sensor was able to detect an average number of 8 photons. Beam test and results 29 29
SiPM signal Start signal Stopsignal
Detector setup (BTF-hall) Analoge signal out. Bias connectors Start counter (T1) Start counter (T1) Cherenkov Counter Al box Start counter (T1) Calorimeter (Calo) (e-/+) beam direction Vacuum valve Cherenkov Counter (C1) Vacuum valve Water cooling sys, Bias voltage sys, temp. controller
Detector setup (BTF-hall) Analoge signal out. Bias connectors Cherenkov Counter Al box Start counter (T1) Start counter (T1) Start counter (T1) (e-/+) beam direction Calorimeter (Calo) Vacuum valve Vacuum valve Cherenkov Counter (C1) Water cooling sys, Bias voltage sys, temp. controller